@powersync/nuxt module includes a PowerSync diagnostics panel that integrates with Nuxt DevTools. It lets you inspect your app’s sync state, local SQLite data, and configuration while running in development.
Enabling Diagnostics
Addpowersync: { useDiagnostics: true } to your nuxt.config.ts:
nuxt.config.ts
useDiagnostics: true is set, NuxtPowerSyncDatabase automatically extends your schema with the diagnostics schema, sets up diagnostics recording and logging, and stores the connector internally so the inspector can access it.
Accessing the Inspector
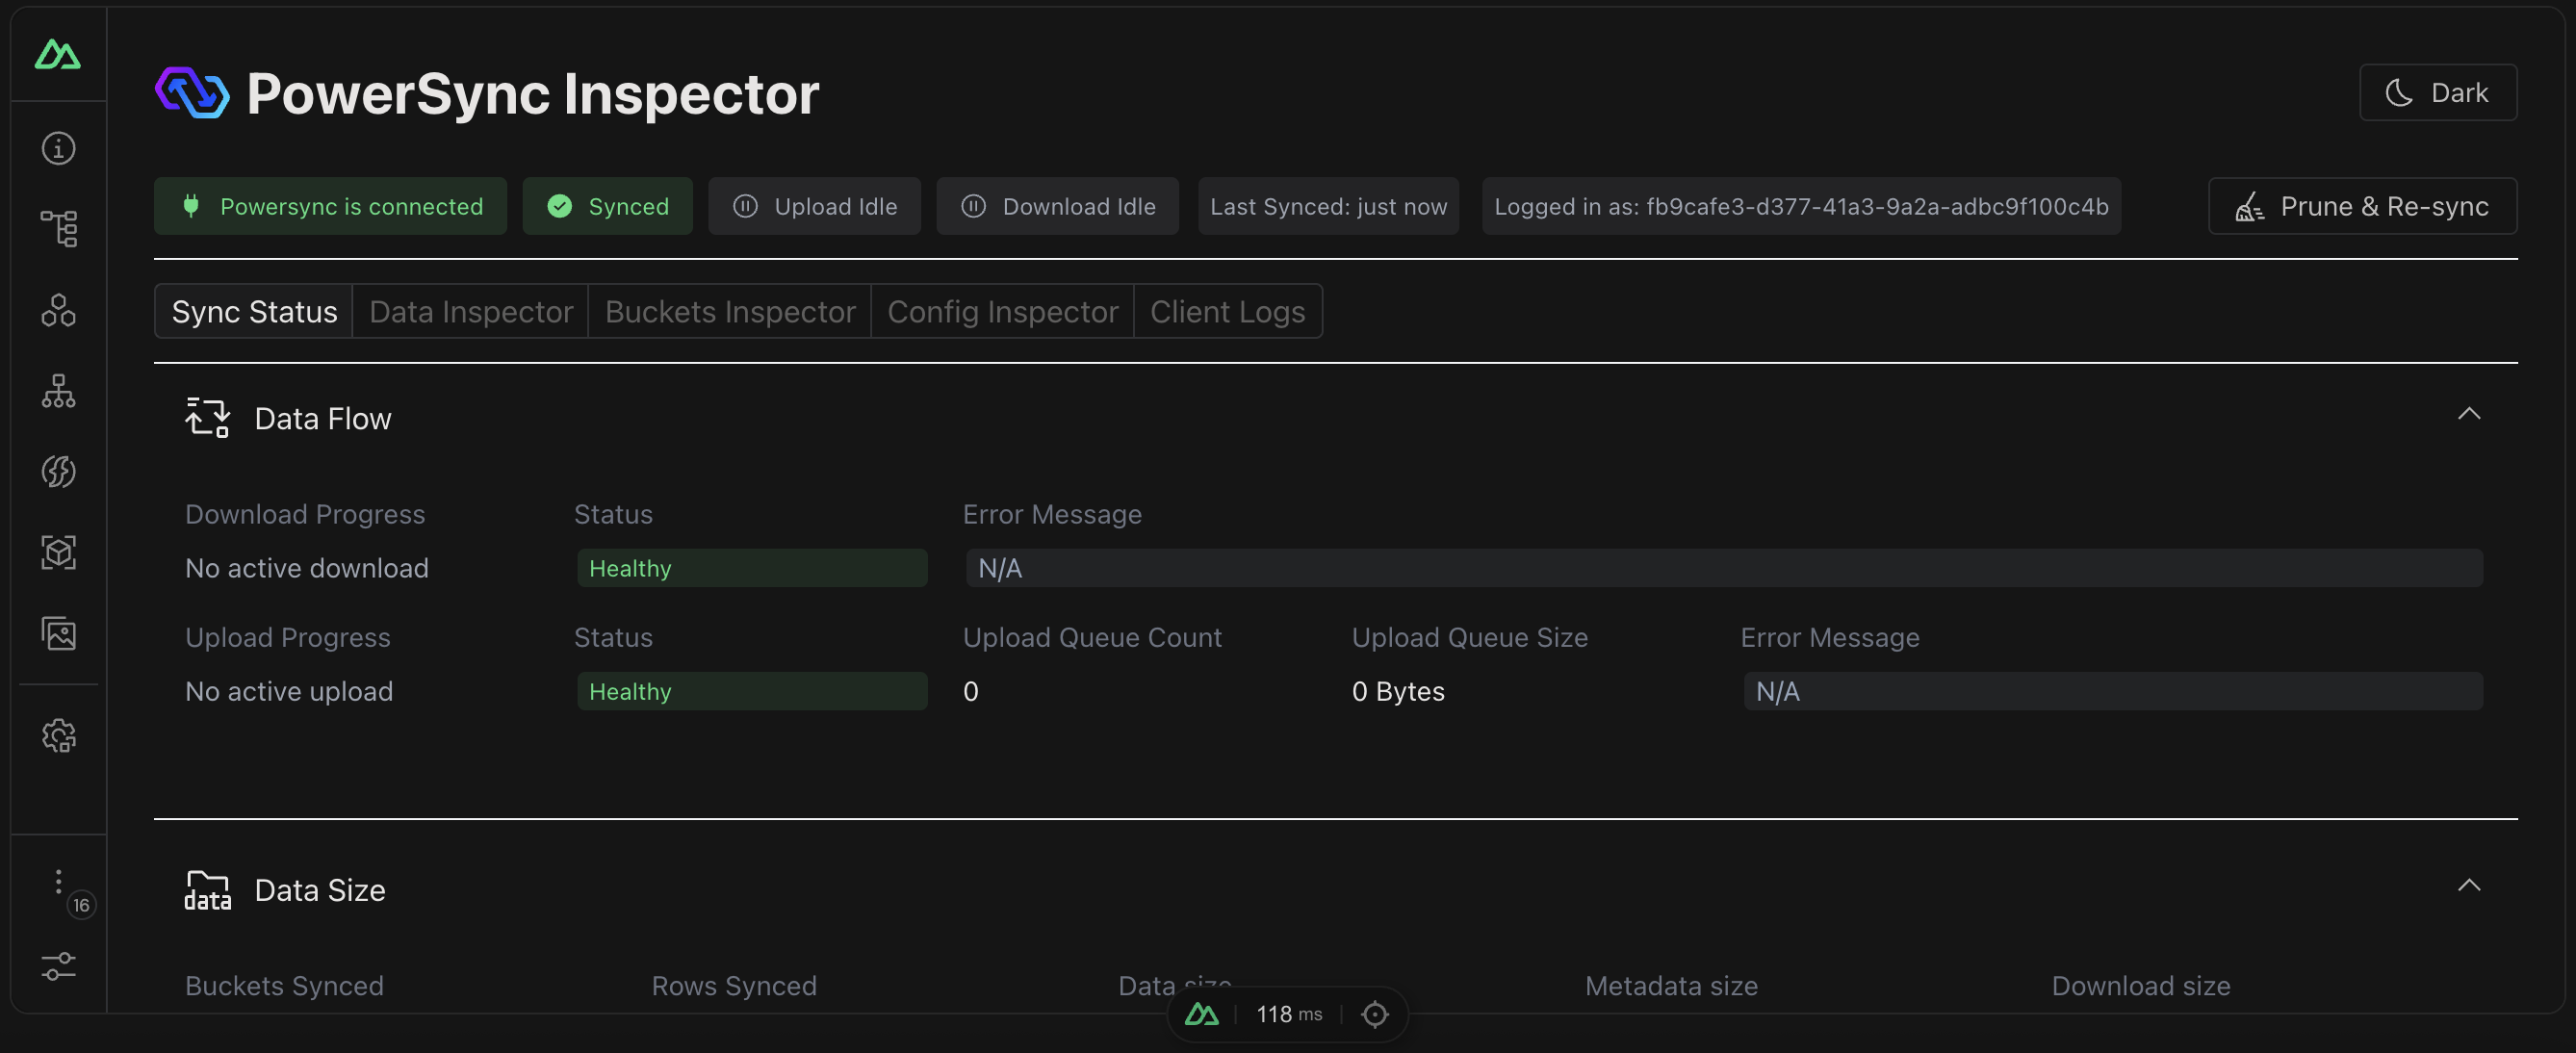
The PowerSync diagnostics panel inside Nuxt DevTools.
- Nuxt DevTools: open DevTools in your browser and navigate to the PowerSync tab.
- Direct URL: navigate to
http://localhost:3000/__powersync-inspector.
Inspector Views
Known Issues
The inspector usesunocss as a transitive dependency, which can conflict with Tailwind CSS. If you use Tailwind, add the following to your nuxt.config.ts:
nuxt.config.ts