PowerSyncDatabase instance while your app is running during development. The Overview helps you see how the client is connected, whether there are any sync issues, and details about each Sync Stream. You can open the same session in the Sync Diagnostics Client for further sync activity details. The SQL Console is for running SQL and sampling rows from the on-device SQLite database.
The extension is included in the powersync package from v2.1.0 and activates automatically when a PowerSyncDatabase is opened. It is disabled in release builds.
Opening the Extension
First, open DevTools:- In VS Code, launch your app in debug mode, then run the Dart: Open DevTools in Browser command from the command palette.
- In Android Studio / Intellij, click the Flutter DevTools button in the run toolbar.
- For apps launched from the command line, see these instructions.
Overview
The Overview tab shows the current state of your database and sync connection.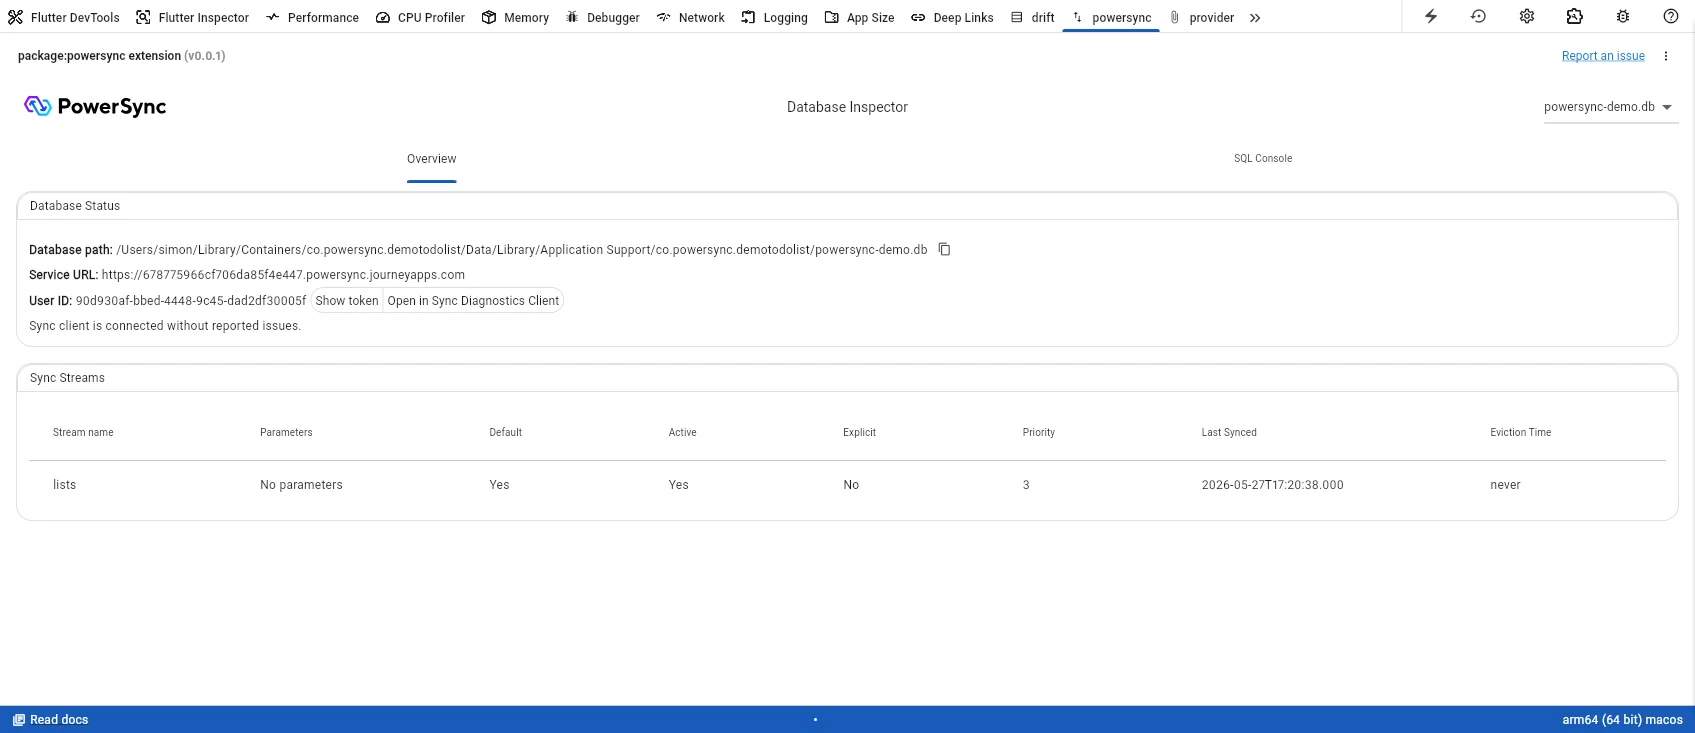
The Overview tab shows database path, service URL, sync status, and a table of active Sync Streams.
- Database path — the full path to the SQLite file on disk, with a copy button. Useful when you need to locate the file for offline inspection.
- Service URL — the PowerSync Service endpoint your app is connected to.
- User ID — the authenticated user’s ID, with a Show token option to reveal the current JWT and an Open in Sync Diagnostics Client link to the Sync Diagnostics Client.
- Sync status — a summary of the connection state and any reported issues.
SQL Console
The SQL Console lets you run queries against your app’s SQLite database.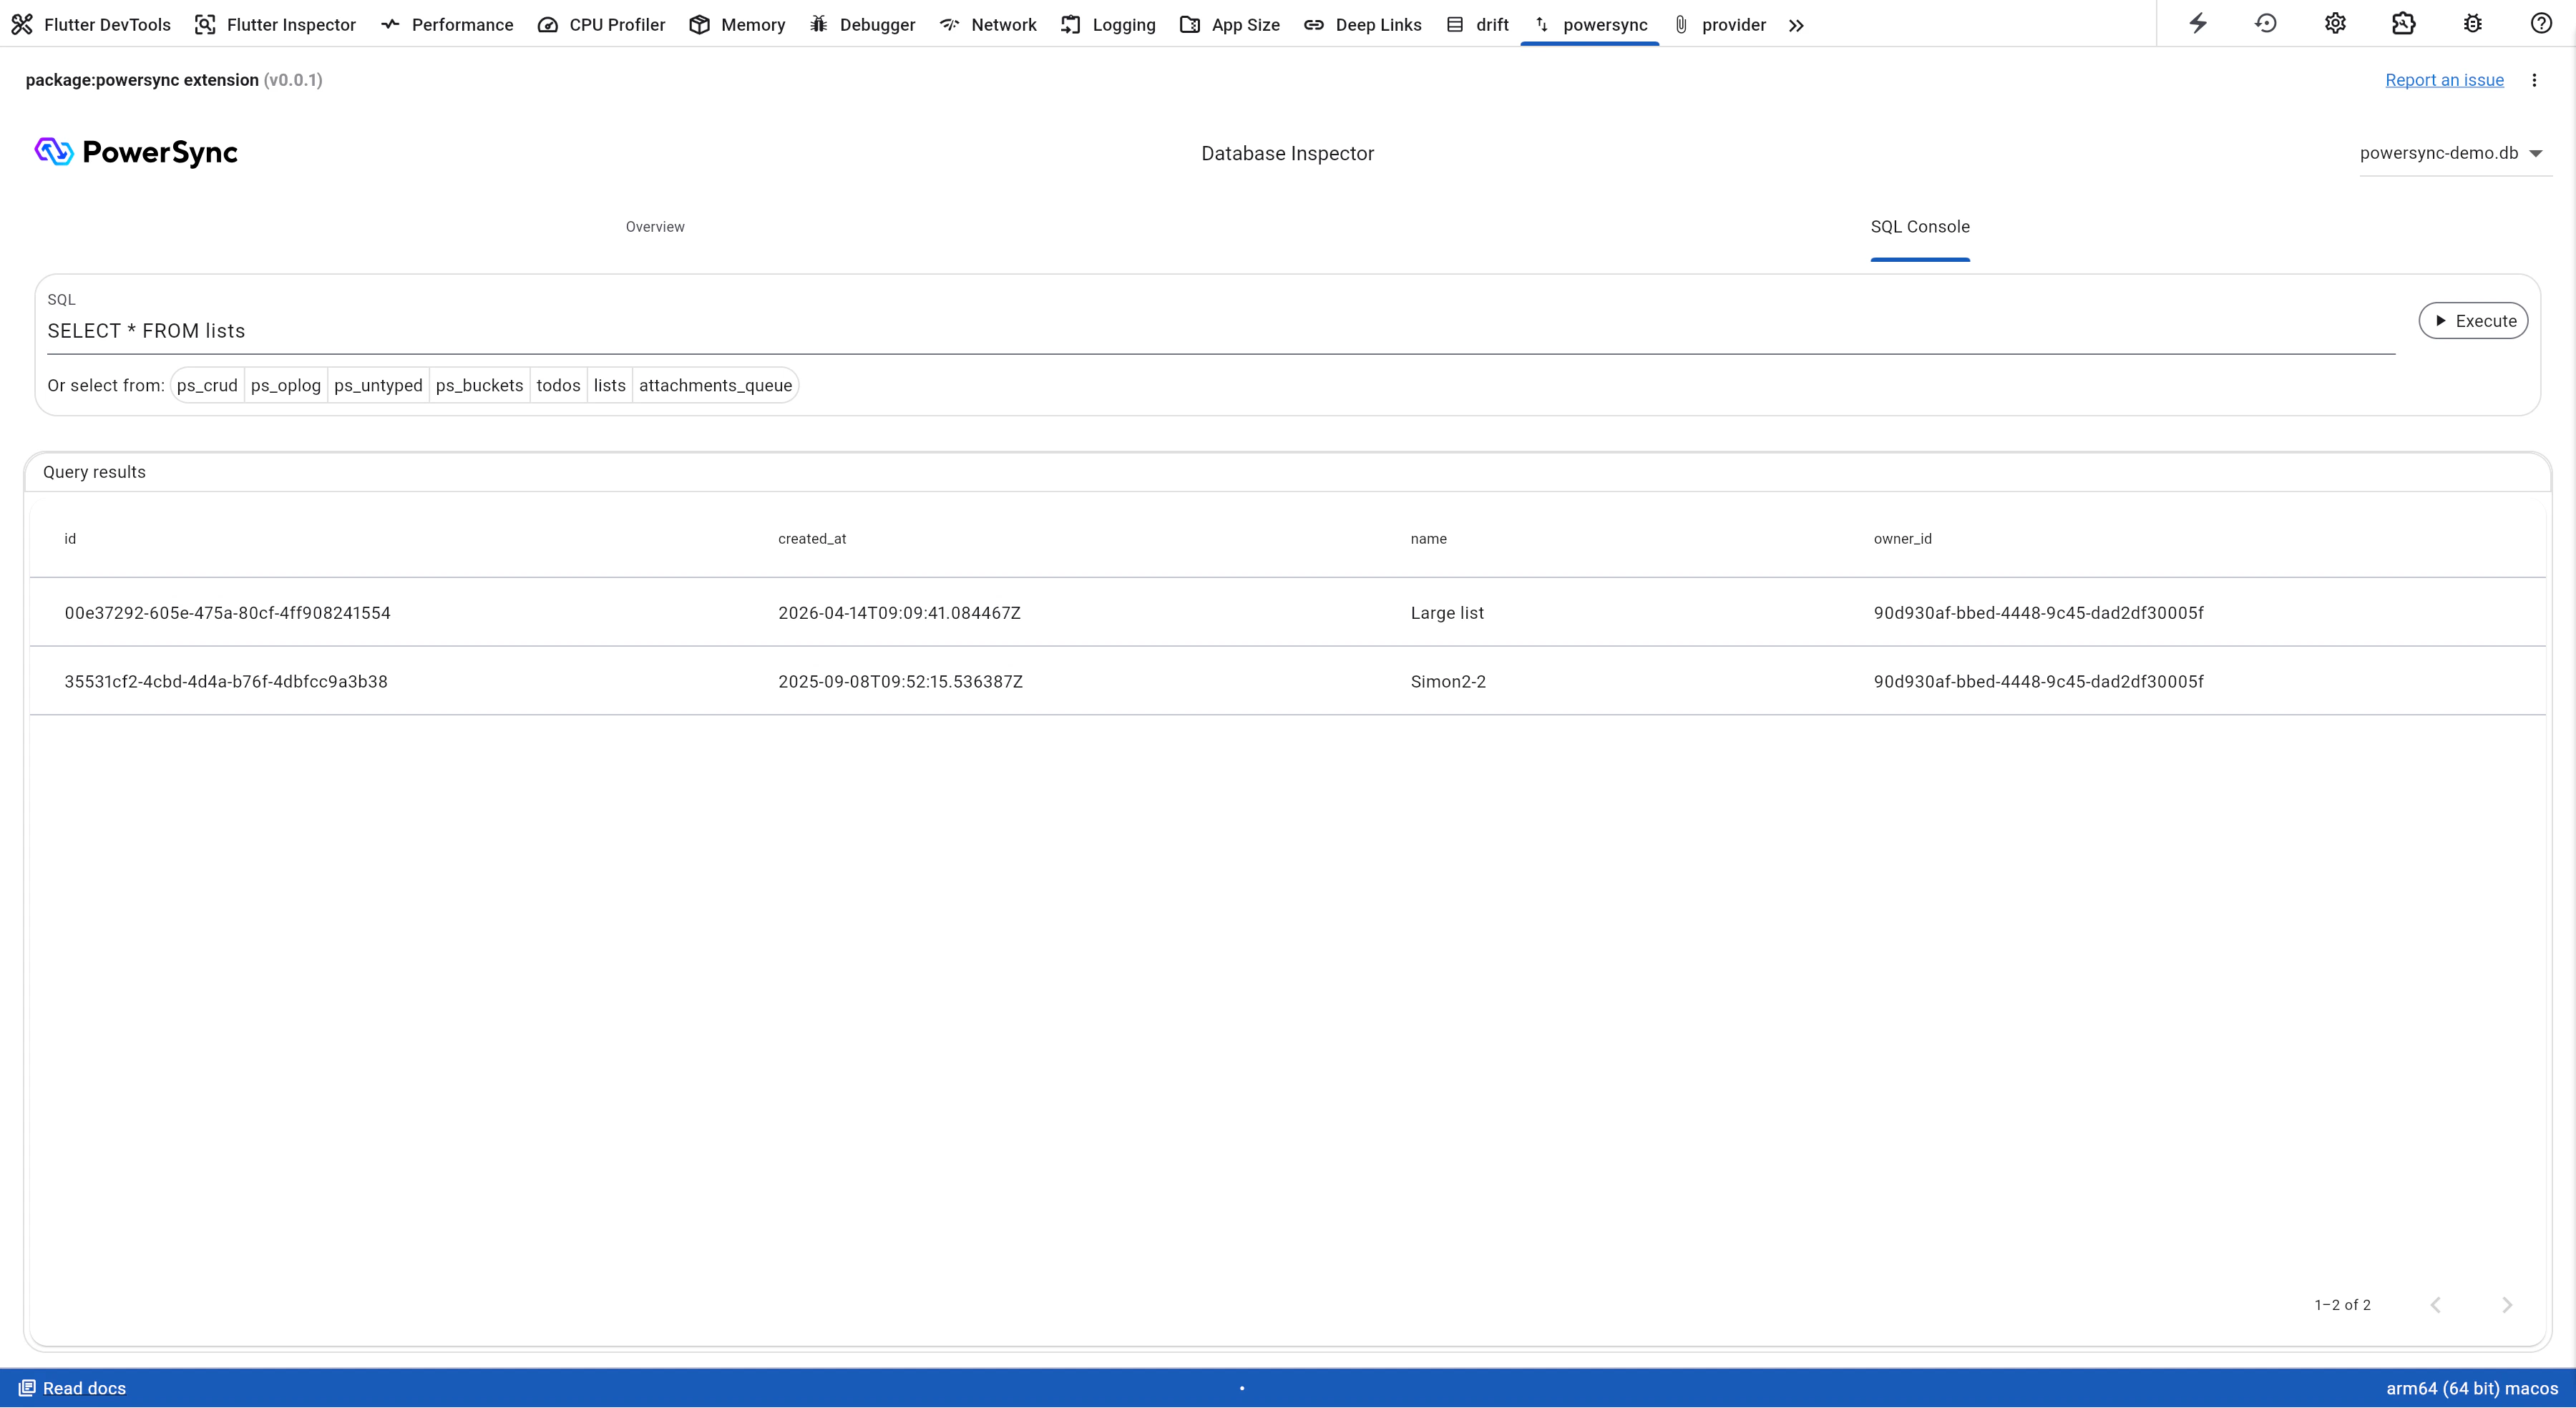
The SQL Console tab with a query running against the lists table.
ps_crud, ps_oplog, ps_untyped, ps_buckets).
The SQL Console runs queries against the local SQLite database only. It does not send queries to your backend source database.