- Client SDK Diagnostics - Implement a sync diagnostics screen/view in your client application that provides critical sync information.
- Client logging - Implement logging in your client application to capture sync events and errors.
- Issue Alerts - Trigger notifications when the PowerSync replicator runs into errors.
- Database - Making sure your database is ready for production when integrated with PowerSync.
Client specific
SDK Diagnostics
It’s important to know what’s going on with a PowerSync enabled client application, this becomes useful during debugging issues with end users. We recommend adding a view/screen in your application that offers diagnostic information about a client. Here you would want to add the following client specific information:connected- Boolean; True if the client is connected to the PowerSync Service instance. False if not.connecting- Boolean; True if the client is attempting to connect to the PowerSync Service instance. False if not.uploading- Boolean; If the client has a network connection and changes in the upload queue are present this will be set to true when the client attempts to upload changes to the backend API in theuploadDatafunction. This option can be found on thedataFlowStatusobject.downloading- Boolean; If the client is connected to the PowerSync Service and new data is available, this will be set to true, else it will be false. This option can be found on thedataFlowStatusobject.hasSynced- Boolean; True if the client completed a full sync at least once. False if the client never completed a full sync.lastSyncedAt- DateTime; Timestamp of when the client last completed a full sync.
SyncStatus class that can be used to access the fields mentioned above.
In addition to the SyncStatus options above, it’s also a good idea to see what the current length of the upload queue looks like.
The upload queue contains all local mutations that need to be processed by the client specific uploadData implementation.
To get this information you can simply count the number of rows present in the internal ps_crud SQLite table e.g.
Client logging
Using Sentry logging for Log Aggregation
This is just an example of how to implement Sentry logging. The actual implementation is up to you as the developer. You don’t have to use
Sentry logging, but we recommend using some sort of log aggregation service in production.App Entry Point
System.ts
Best Practices
- Log Level Management: Use appropriate log levels
(WARN/ERROR)in production - Structured Logging: Include relevant context like user IDs, operation types, timestamps
- Offline Resilience: Always have a local fallback for critical logs
- Performance: Be mindful of log volume to avoid performance impacts
- Privacy: Ensure sensitive data is not logged or is properly sanitized
- Retention: Implement log rotation/cleanup for local storage to manage device storage (if applicable)
Issue Alerts
PowerSync Cloud
The PowerSync Cloud dashboard offers features and functionality that makes it easy to monitor the replication process from your source DB to your PowerSync Service instance and raise alerts when issues occur. We highly recommend you read the sections below and configure alerts as suggested.Replication Issue Alerts
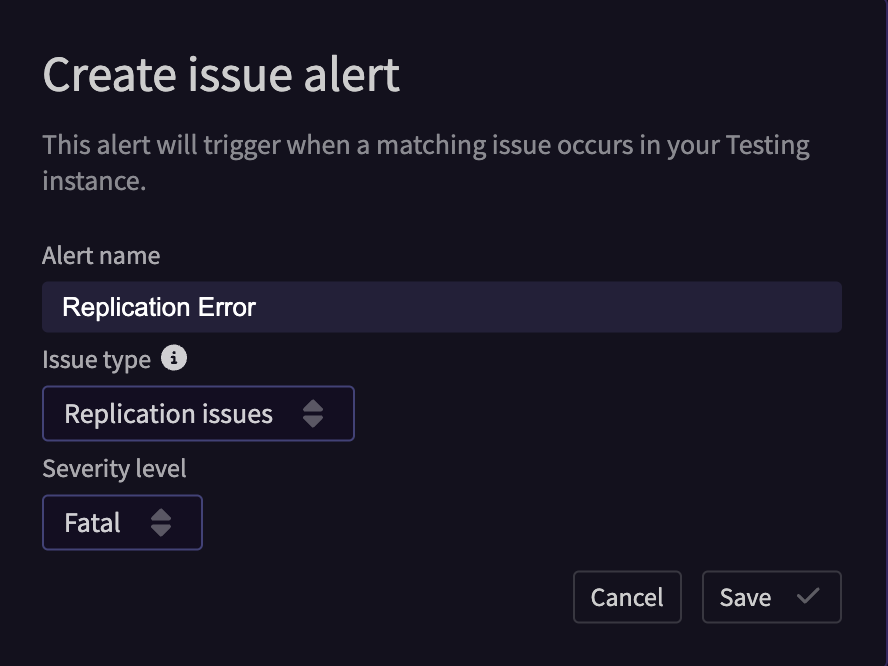
At a minimum we recommend creating an issue alert forReplication issues. For details instructions on how to configure Issue Alerts, see the Issue Alerts section of the Monitoring and Alerting docs.
Here’s quick example of what the Issue alert should look like to catch replication issues:
PowerSync Self-Host
To view the health and errors for a self-hosted PowerSync Service there are a few different options:Health Check Endpoints
The PowerSync Service offers a few HTTP endpoints you can probe to perform health checks on an instance. These endpoints will return a specific HTTP status code dependent on the current health of the instance, but will not give specific error information. For more information on this, see the Health Checks docs.Diagnostics API
The PowerSync Service Diagnostics API is an easy way to get details around specific errors that are taking place on an instance. To configure replication issue alerts for self-hosted instances, we recommend using the Diagnostics API which ships with the PowerSync Service, as the source of replication issues that could occur. First, make sure you’ve configured the Diagnostics API for your PowerSync Service. To do so, follow the steps outlined in the PowerSync Self-Host Diagnostics docs. Once enabled, send a request to the Diagnostics API to see the current status. The response of the request from the Diagnostics API would look something like this:Database Best Practices
Postgres
Managing & Monitoring Replication Lag
Because PowerSync relies on Postgres logical replication, it’s important to consider the size of themax_slot_wal_keep_size and monitoring lag of replication slots used by PowerSync in a production environment to ensure lag of replication slots do not exceed the max_slot_wal_keep_size.
The WAL growth rate is expected to increase substantially during the initial replication of large datasets with high update frequency, particularly for tables included in the PowerSync publication.
During normal operation (after Sync Streams (or legacy Sync Rules) are deployed) the WAL growth rate is much smaller than the initial replication period, since the PowerSync Service can replicate ~5k operations per second, meaning the WAL lag is typically in the MB range as opposed to the GB range.
When deciding what to set the max_slot_wal_keep_size configuration parameter the following should be taken in account:
- Database size - This impacts the time it takes to complete the initial replication from the source Postgres database.
- Sync Streams/Sync Rules complexity - This also impacts the time it takes to complete the initial replication.
- Postgres update frequency - The frequency of updates (of tables included in the publication you create for PowerSync) during initial replication. The WAL growth rate is directly proportional to this.
max_slot_wal_keep_size you can run the following query:
max_slot_wal_keep_size when deploying Sync Streams/Sync Rules changes to your PowerSync Service instance, especially when you’re working with large database volumes.
If you notice that the replication lag is greater than the current max_slot_wal_keep_size it’s recommended to increase value of the max_slot_wal_keep_size on the connected source Postgres database to accommodate for the lag and to ensure the PowerSync Service can complete initial replication without further delays.
Managing Replication Slots
Under normal operating conditions when new Sync Streams/Sync Rules are deployed to a PowerSync Service instance, a new replication slot will also be created and used for replication. The old replication slot from the previous version of the sync config will still remain, until reprocessing is completed, at which point the old replication slot will be removed by the PowerSync Service. However, in some cases, a replication slot may remain without being used. Usually this happens when a PowerSync Service instance is de-provisioned, stopped intentionally or due to unexpected errors. This results in excessive disk usage due to the continued growth of the WAL. To check which replication slots used by a PowerSync Service are no longer active, the following query can be executed against the source Postgres database:idle_replication_slot_timeout configuration parameter on the source Postgres database.
The
idle_replication_slot_timeout configuration parameter is only available from PostgresSQL 18 and above.idle_replication_slot_timeout will invalidate replication slots that have remained inactive for longer than the value set for the idle_replication_slot_timeout parameter.
It’s recommended to configure this parameter for source Postgres databases as this will prevent runaway WAL growth for replication slots that are no longer active or used by the PowerSync Service.