> ## Documentation Index
> Fetch the complete documentation index at: https://docs.powersync.com/llms.txt
> Use this file to discover all available pages before exploring further.
# Dart & Flutter DevTools Extension
> A Dart & Flutter DevTools extension for inspecting PowerSync databases, running SQL queries, and viewing sync status during development.
The PowerSync DevTools extension adds a Database Inspector panel to [Dart & Flutter DevTools](https://docs.flutter.dev/tools/devtools/overview). It gives you a view into an open `PowerSyncDatabase` instance while your app is running during development. The Overview helps you see how the client is connected, whether there are any sync issues, and details about each Sync Stream. You can open the same session in the [Sync Diagnostics Client](/tools/diagnostics-client) for further sync activity details. The SQL Console is for running SQL and sampling rows from the on-device SQLite database.
The extension is included in the `powersync` package from v2.1.0 and activates automatically when a `PowerSyncDatabase` is opened. It is disabled in release builds.
## Opening the Extension
First, open DevTools:
* In **VS Code**, launch your app in debug mode, then run the **Dart: Open DevTools in Browser** command from the command palette.
* In **Android Studio / Intellij**, click the **Flutter DevTools** button in the run toolbar.
* For apps launched from the command line, see [these instructions](https://docs.flutter.dev/tools/devtools/cli).
In DevTools, A **powersync** tab appears in the DevTools tab bar alongside the standard panels.
If you have multiple databases open, use the dropdown in the top-right corner to switch between them.
## Overview
The Overview tab shows the current state of your database and sync connection.
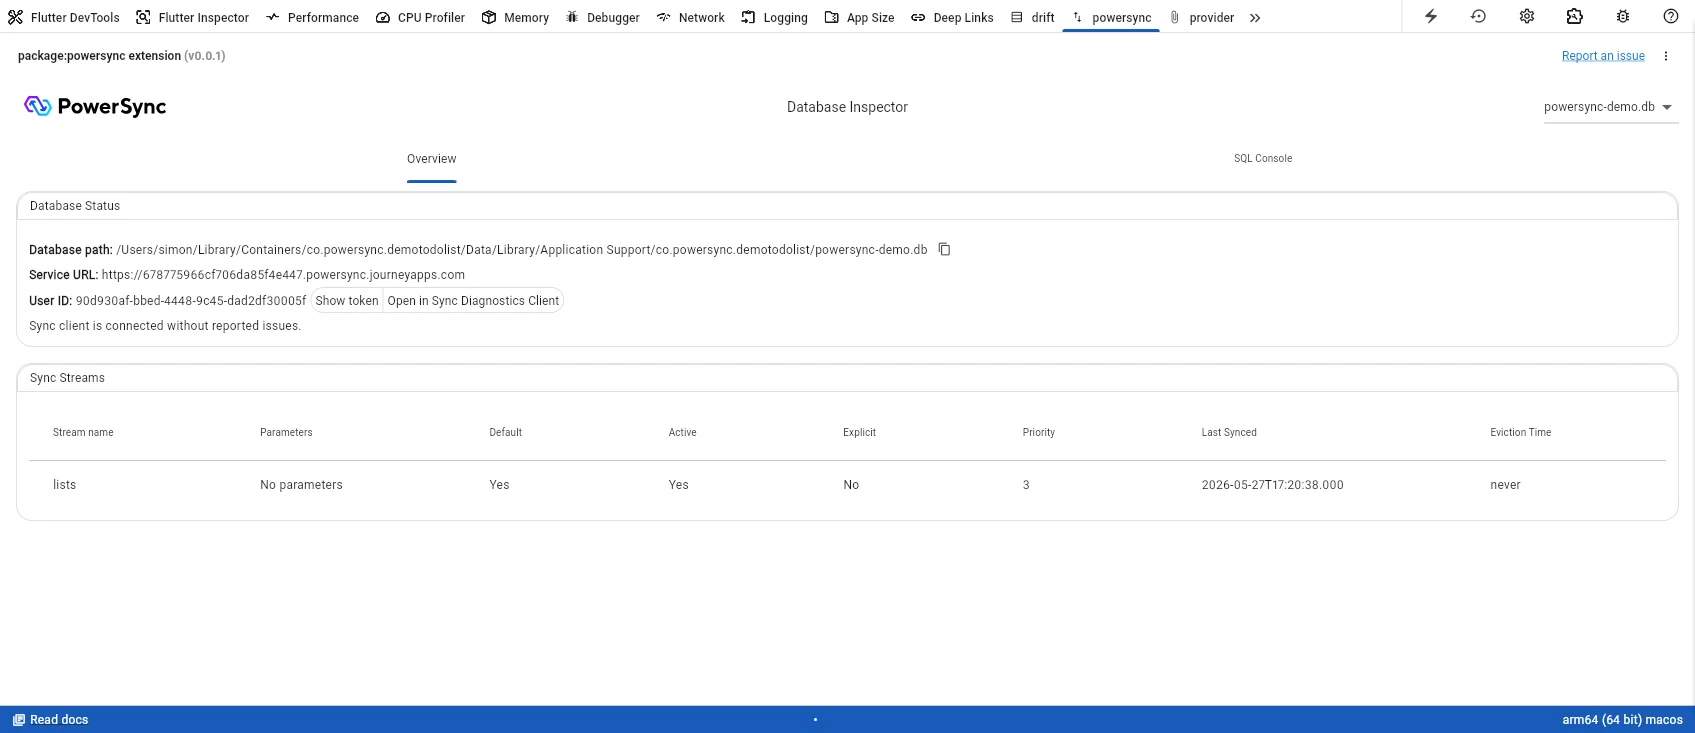 **Database Status** displays:
* **Database path** — the full path to the SQLite file on disk, with a copy button. Useful when you need to locate the file for [offline inspection](/maintenance-ops/client-database-diagnostics).
* **Service URL** — the PowerSync Service endpoint your app is connected to.
* **User ID** — the authenticated user's ID, with a **Show token** option to reveal the current JWT and an **Open in Sync Diagnostics Client** link to the [Sync Diagnostics Client](/tools/diagnostics-client).
* **Sync status** — a summary of the connection state and any reported issues.
Sync Streams lists each active stream with its configuration and sync state, including parameters, priority, last synced timestamp, and eviction time.
## SQL Console
The SQL Console lets you run queries against your app's SQLite database.
**Database Status** displays:
* **Database path** — the full path to the SQLite file on disk, with a copy button. Useful when you need to locate the file for [offline inspection](/maintenance-ops/client-database-diagnostics).
* **Service URL** — the PowerSync Service endpoint your app is connected to.
* **User ID** — the authenticated user's ID, with a **Show token** option to reveal the current JWT and an **Open in Sync Diagnostics Client** link to the [Sync Diagnostics Client](/tools/diagnostics-client).
* **Sync status** — a summary of the connection state and any reported issues.
Sync Streams lists each active stream with its configuration and sync state, including parameters, priority, last synced timestamp, and eviction time.
## SQL Console
The SQL Console lets you run queries against your app's SQLite database.
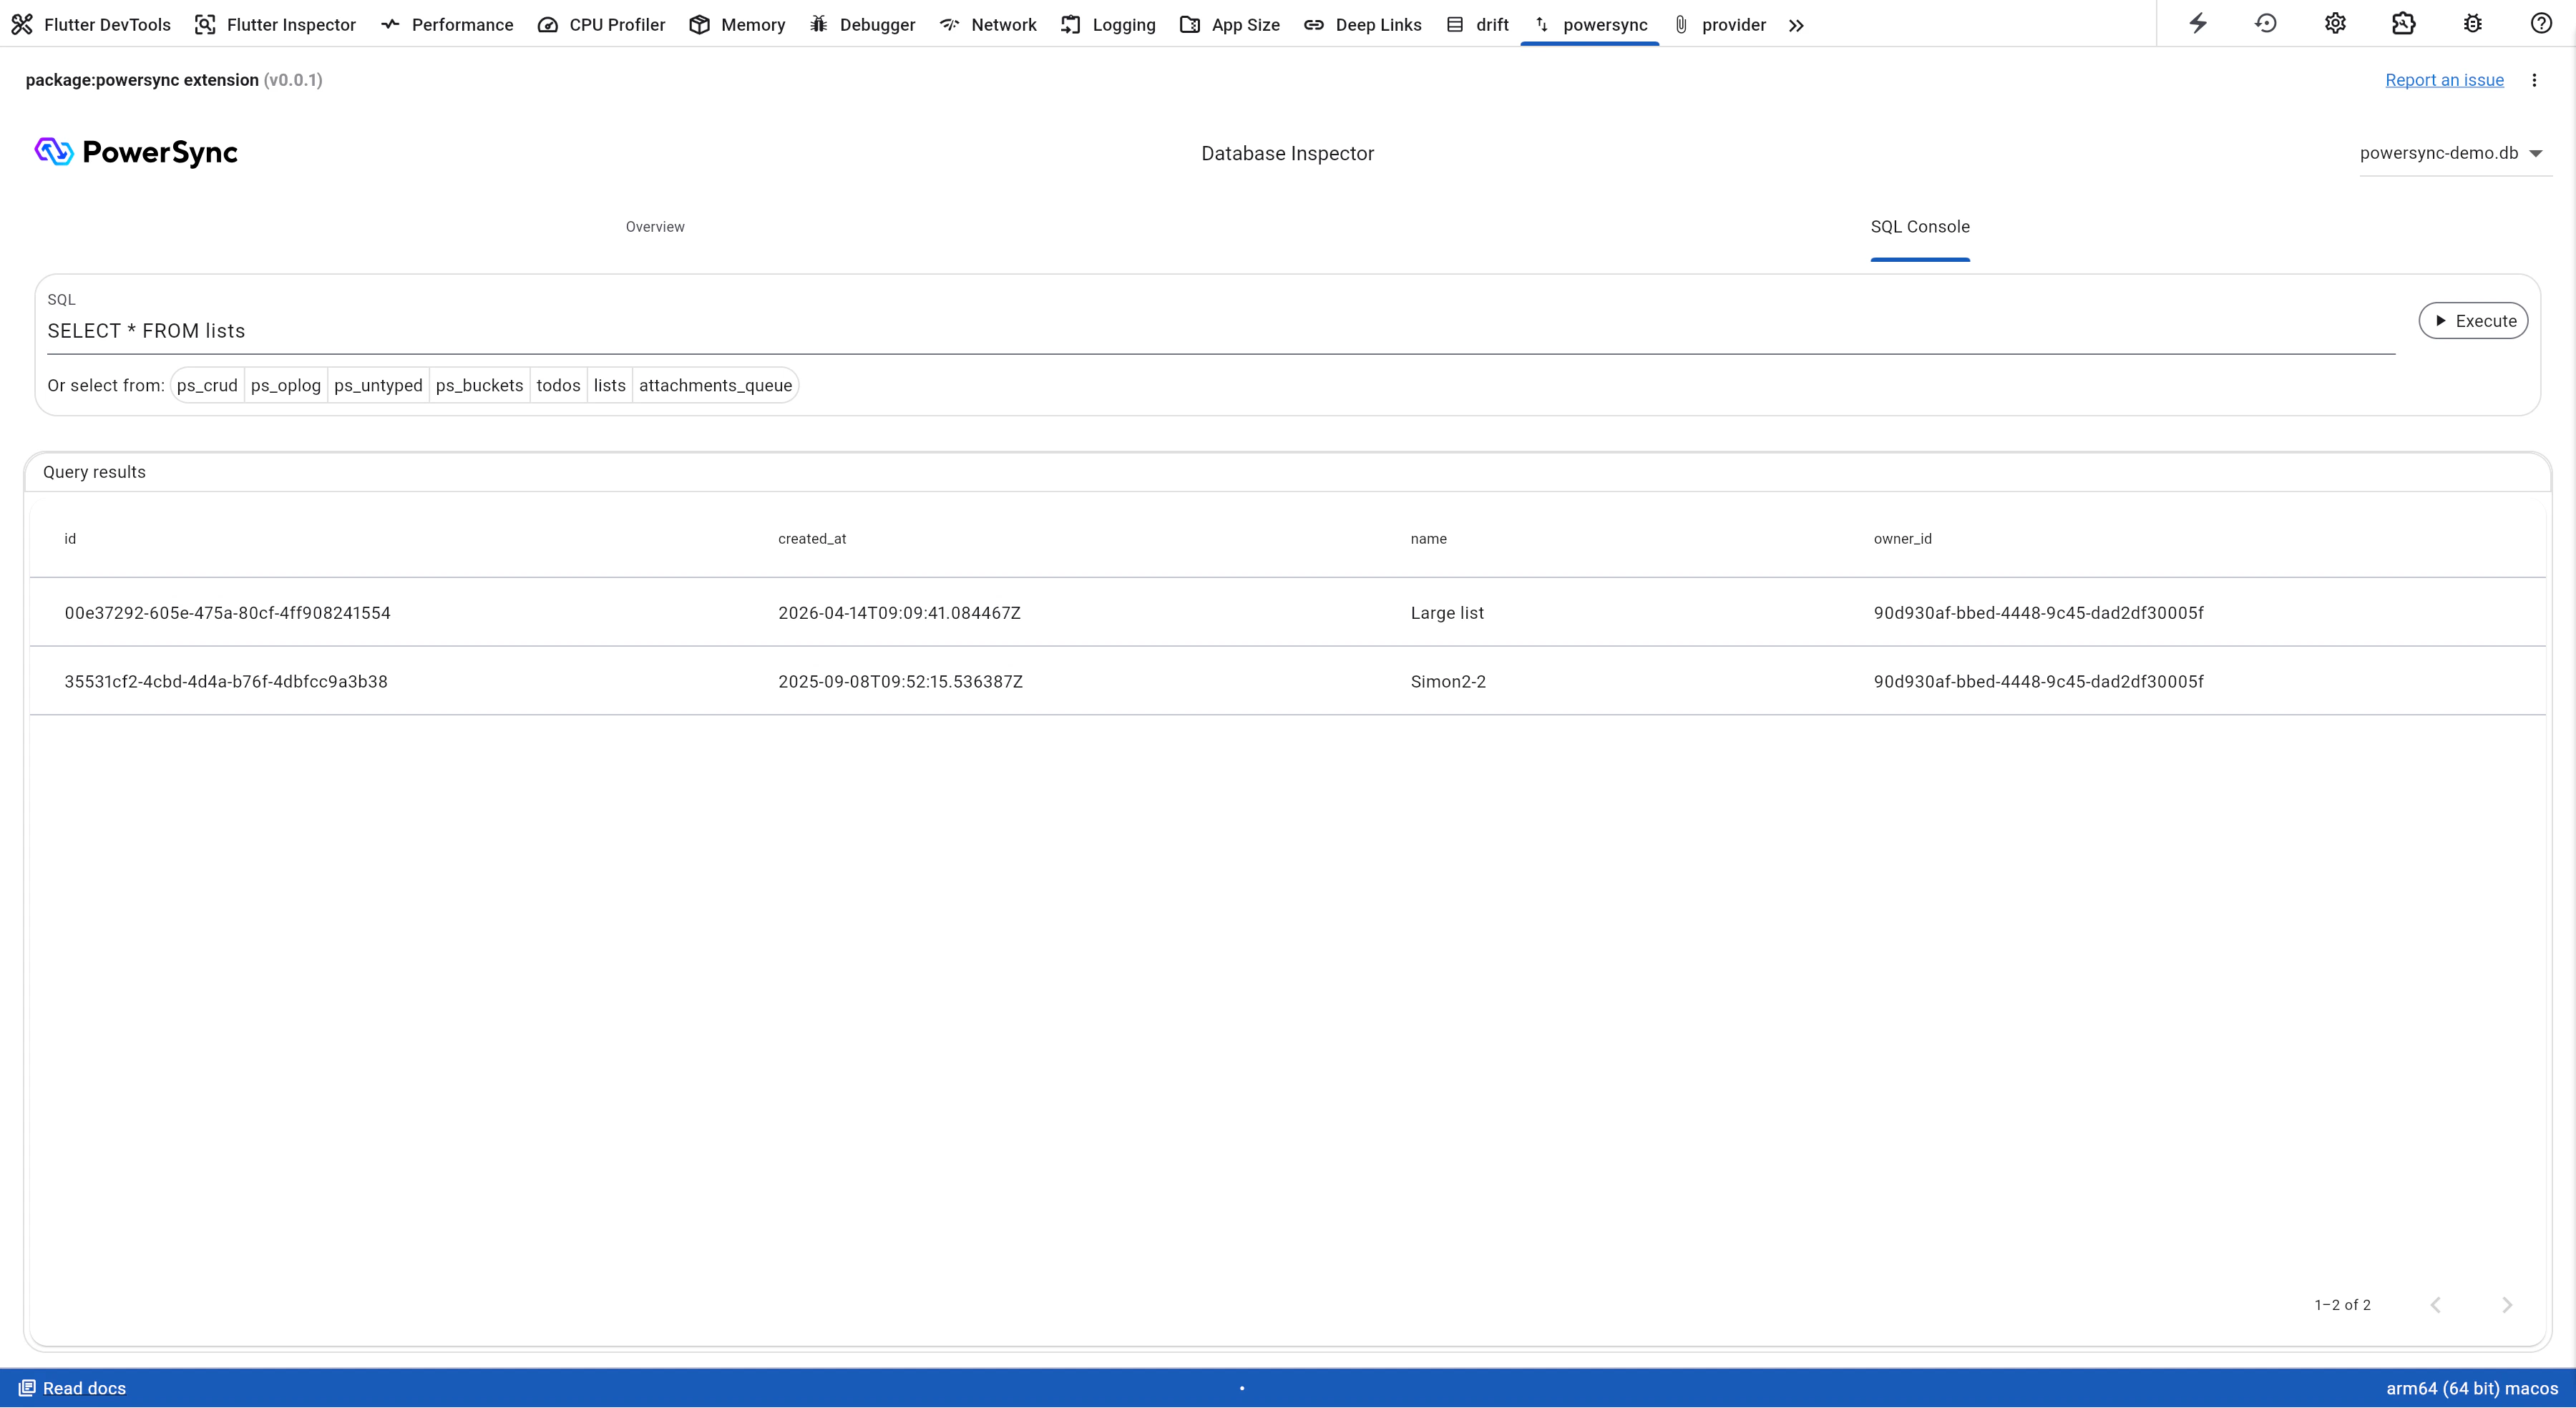 Type any SQL into the editor and click **Execute** to run it. Results appear in a paginated table below.
The **Or select from:** row shows shortcut buttons for every table in the database. These include both your schema tables and the internal PowerSync tables (`ps_crud`, `ps_oplog`, `ps_untyped`, `ps_buckets`).
The SQL Console runs queries against the local SQLite database only. It does not send queries to your backend source database.
Type any SQL into the editor and click **Execute** to run it. Results appear in a paginated table below.
The **Or select from:** row shows shortcut buttons for every table in the database. These include both your schema tables and the internal PowerSync tables (`ps_crud`, `ps_oplog`, `ps_untyped`, `ps_buckets`).
The SQL Console runs queries against the local SQLite database only. It does not send queries to your backend source database.