> ## Documentation Index
> Fetch the complete documentation index at: https://docs.powersync.com/llms.txt
> Use this file to discover all available pages before exploring further.
# FAQ & Troubleshooting
> Troubleshoot usage and billing issues and find answers to common questions about PowerSync Cloud usage metering and billing.
We have simplified our Cloud pricing plans and billing. Learn more in the [blog post](https://www.powersync.com/blog/simplified-cloud-pricing-based-on-data-synced).
We are continuously improving the reporting and tools to help you troubleshoot usage. Please [reach out](/resources/contact-us) if you have any feedback or need help understanding or managing your usage.
## Usage and Billing Metrics FAQs
You can track usage in two ways:
* **Individual instances**: Visit the [Usage metrics](/maintenance-ops/monitoring-and-alerting#usage-metrics) workspace in the PowerSync Dashboard to see metrics for a specific instance.
* **Organization-wide**: Go to your organization in the [PowerSync Dashboard](https://dashboard.powersync.com/) and check the **Plan Usage** section for aggregated metrics across all instances in your current billing cycle.
A sync operation occurs when a single row is synced from the PowerSync Service to a user device.
The PowerSync Service maintains a history of operations for each row to ensure efficient streaming and data integrity. This means:
* Every row change (insert, update, delete) creates a new operation, and this operations history accumulates over time.
* When a new client connects, it downloads the entire history on first sync.
* Existing clients only download new operations since their last sync.
As a result, sync operation counts often exceed the number of actual data mutations, especially for frequently updated rows. This is normal.
You can manage operations history through:
* Daily automatic compacting (built into PowerSync Cloud)
* Regular [defragmentation](/maintenance-ops/compacting-buckets#defragmenting) (recommended for frequently updated data)
See the [Usage Troubleshooting](#usage-troubleshooting) section for more details.
**Billing note:** Sync operations are not billed under the [updated Cloud pricing model](https://www.powersync.com/blog/simplified-cloud-pricing-based-on-data-synced). Billing for data throughput is based on "data synced" instead. You can still use sync operation counts for diagnostics.
A concurrent connection is one client actively connected to the PowerSync Service. When a device calls `.connect()`, it establishes one long-lived connection for streaming real-time updates.
Key points about concurrent connections:
* Billing is based on peak concurrent connections, which is the highest number of simultaneous connections during the billing cycle.
* **Billing (Pro/Team)**: 1,000 connections are included, then \$30 per 1,000 over the included amount.
* PowerSync Cloud Pro plan is limited to 3,000 concurrent connections.
* PowerSync Cloud Team plan is limited to 10,000 concurrent connections by default.
* PowerSync Cloud Free plans are limited to 50 peak concurrent connections.
* When limits are reached, new connection attempts receive a 429 HTTP response while existing connections continue syncing. Clients retry after a delay and should connect once capacity is available.
Data synced is the only metric used for data throughput billing in our [updated Cloud pricing model](https://www.powersync.com/blog/simplified-cloud-pricing-based-on-data-synced).
It measures the total uncompressed size of data synced from PowerSync Service instances to client devices. If multiple users sync the same data, each transfer counts toward the total.
**Billing (Pro/Team)**: 30 GB included, then \$1.00 per GB over the included amount.
The PowerSync Service hosts three types of data:
1. A current copy of the data, which should be roughly equal to the subset of your source data covered by your Sync Streams (or legacy Sync Rules).
2. A history of all operations on data in buckets, which can be larger than the source since it includes history and one row can be in multiple buckets.
3. Data for parameter lookups, which is typically small.
Because of this structure, your hosted data size may be larger than your source database size.
**Billing (Pro/Team)**: 10 GB included, then \$1.00 per GB over the included amount.
**Note:** The data processing billing metric has been removed in our [updated Cloud pricing model](https://www.powersync.com/blog/simplified-cloud-pricing-based-on-data-synced).
Data processing was calculated as the total uncompressed size of data replicated from your source database(s) to PowerSync Service instances, plus data synced from PowerSync Service instances to user devices. These values are still available in your [Usage metrics](/maintenance-ops/monitoring-and-alerting#usage-metrics) as "Data replicated per day/hour" and "Data synced per day/hour".
Data replicated refers to activity from your backend source database (Postgres, MongoDB, MySQL, SQL Server, or Convex) to the PowerSync Service — this is not billed.
Data synced refers to data streamed from the PowerSync Service to client devices — this is used for billing.
## Billing FAQs
Go to your organization in the [PowerSync Dashboard](https://dashboard.powersync.com/) and open the **Plan Usage** section. This shows your total usage (aggregated across all projects) for your current billing cycle. Data updates once a day.
Update your billing details in the **Plans & Billing** section of the [PowerSync Dashboard](https://dashboard.powersync.com/) at the organization level.
Review your historic invoices in the Stripe Customer Portal by signing in with your billing email [here](https://billing.stripe.com/p/login/7sI6pU48L42cguc7ss). We may surface these in the Dashboard in the future.
Under the updated pricing for Pro and Team plans, the following metrics are billed:
* **Data synced**: 30 GB included, then \$1.00 per GB over the included amount.
* **Peak concurrent connections**: 1,000 included, then \$30 per 1,000 over the included amount.
* **Data hosted**: 10 GB included, then \$1.00 per GB over the included amount (unchanged from before).
The following metrics are not billed:
* Replication operations (count)
* Data replicated (per GB)
* Sync operations (count)
See the blog post for details: [Simplified Cloud Pricing Based On Data Synced](https://www.powersync.com/blog/simplified-cloud-pricing-based-on-data-synced). For plan specifics, see [our Pricing](https://www.powersync.com/pricing).
## Usage Troubleshooting
If you're seeing unexpected spikes in your usage metrics, here's how to diagnose and fix common issues:
### Common Usage Patterns
#### More Operations Than Rows
If you're syncing significantly more operations than you have rows in your database, this usually indicates a large operations history has built up. This is common with frequently updated data.
**Solution:** [Defragmentation](/maintenance-ops/compacting-buckets#defragmenting) reduces the operations history by compacting buckets. While defragmentation triggers additional sync operations for existing users, it significantly reduces operations for new installations.
Use the [Sync Diagnostics Client](https://github.com/powersync-ja/powersync-js/tree/main/tools/diagnostics-app) to compare total rows vs. operations synced to identify if this is affecting you.
#### Repetitive Syncing by the Same User
If you see the same user syncing repeatedly in quick succession, this could indicate a client code issue.
**First steps to troubleshoot:**
1. **Check SDK version**: Ensure you're using the latest SDK version.
2. **Review client logs**: Check your client-side logs for connection issues or sync loops.
3. **Check instance logs**: Review [Instance logs](/maintenance-ops/monitoring-and-alerting#instance-logs) to see sync patterns and identify which users are affected.
If you need help, [contact us](/resources/contact-us) with your logs for further diagnosis.
### Concurrent Connections
The most common cause of excessive concurrent connections is opening multiple copies of `PowerSyncDatabase` and calling `.connect()` on each. Debug your connection handling by reviewing your code and [Instance logs](/maintenance-ops/monitoring-and-alerting#instance-logs). Ensure you're only opening one connection per user/session.
### Sync Operations
Sync operations are not billed in our updated pricing model, but they're useful for diagnosing spikes in data synced and understanding how data mutations affect usage.
While sync operations typically correspond to data mutations on synced rows (those in your Sync Streams/Sync Rules), several scenarios can affect your operation count:
#### Key Scenarios
1. **New App Installations:**
New users need to sync the complete operations history. We help manage this by running automatic daily compacting on Cloud instances and providing manual [defragmentation options](/maintenance-ops/compacting-buckets#defragmenting) in the PowerSync Dashboard.
2. **Existing Users:**
Compacting and defragmenting reduce operations history but trigger additional sync operations for existing users. See our [defragmenting guide](/maintenance-ops/compacting-buckets#defragmenting) to optimize this.
3. **Sync Rule Deployments:**
When you deploy changes to Sync Streams/Sync Rules, PowerSync recreates buckets from scratch. New app installations sync fewer operations since the operations history is reset, but existing users temporarily experience increased sync operations as they re-sync the updated buckets.
We're working on [incremental reprocessing](https://roadmap.powersync.com/c/85-more-efficient-sync-reprocessing), which will only reprocess buckets whose definitions have changed.
4. **Unsynced Columns:**
Any row update triggers a new operation in the logical replication stream, regardless of which columns changed. PowerSync tracks changes at the row level, not the column level. This means updates to columns not included in your Sync Streams/Sync Rules still create sync operations, and even a no-op update like `UPDATE mytable SET id = id` generates a new operation for each affected row.
Selectively syncing columns helps with data access control and reducing data transfer size, but it doesn't reduce the number of sync operations.
### Data Synced
Data synced measures the total uncompressed bytes streamed from the PowerSync Service to clients. Spikes typically come from either many sync operations (high churn) or large rows (large payloads), and can also occur during first-time syncs, defragmentation, or Sync Rule updates.
If your spikes in data synced correspond with spikes in sync operations, also see the [Sync Operations](#sync-operations) troubleshooting guidelines above.
#### Diagnose Data Synced Spikes
1. **Pinpoint when it spiked:**
Use [Usage Metrics](/maintenance-ops/monitoring-and-alerting#usage-metrics) to find the exact hour/day of the spike.
2. **Inspect instance logs for size:**
In [Instance Logs](/maintenance-ops/monitoring-and-alerting#instance-logs), use the **Search** input to find `"sync stream complete"` entries. Each entry shows the size of data transferred and operations synced per stream on its metadata pills.
To narrow further, you can either:
* Type a structured filter in the **Search** input, e.g. `user:`.
* Click **Property filters** next to the search input and pick a property (User ID, Client ID, Request ID, Error code, etc.). Error code and Close reason offer a dropdown of known values.
* Click any metadata pill on a log entry and choose **Add filter** to pin that value as a filter. Useful for following `user_id`, `client_id`, or custom `app_metadata_*` log properties without typing.
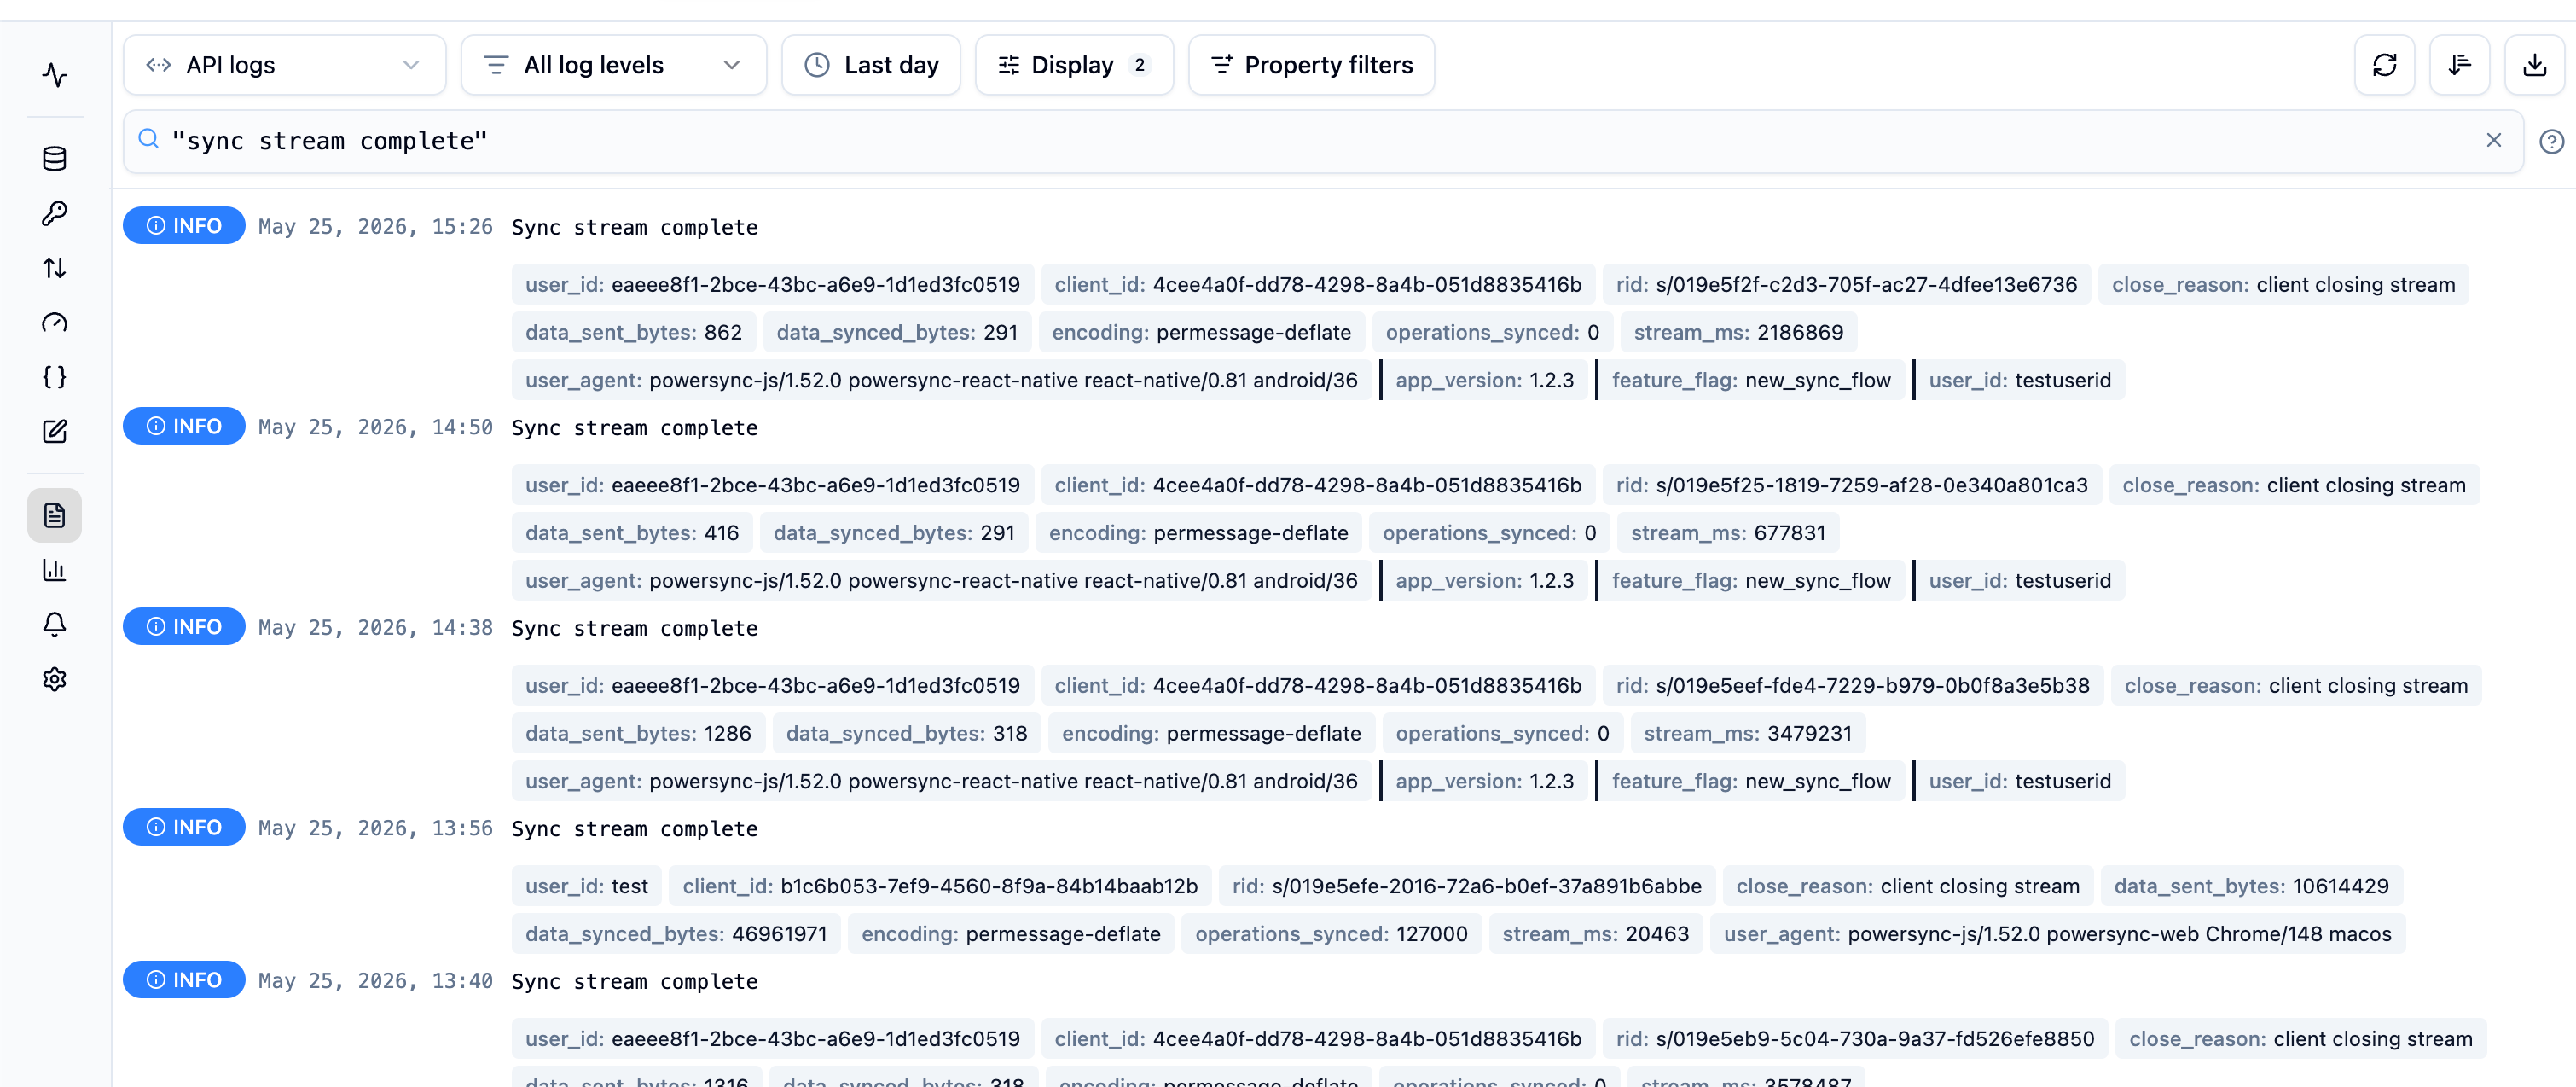 You may need to scroll to load more logs. To get the filtered logs as a file, click the **Export** (download) button in the top-right of the logs toolbar. It exports the currently visible logs to CSV.
3. **Compare operations vs row sizes:**
If operations are high and size scales with it, you likely have tables being updated frequently, or a large operations history has built up. See our [defragmenting guide](/maintenance-ops/compacting-buckets#defragmenting). If operations are moderate but size is large, your rows likely contain large data (e.g., large JSON columns or blobs).
4. **Identify large payloads in your database:**
Check typical row sizes for frequently updated tables and look for large columns (e.g., long TEXT/JSON fields, embedded files).
5. **Consider recent maintenance and app changes:**
Defragmentation and Sync Rule deploys cause existing clients to re-sync content, temporarily increasing data synced. New app installs trigger initial full sync, so expect higher usage when onboarding new sets of users.
### Data Hosted
Your hosted data size may be larger than your source database size because it includes the history of all operations on data in buckets. This can be bigger than the source since it includes history, and one row can be in multiple buckets.
Data hosted can temporarily spike during Sync Rule deployments and defragmentation because buckets are reprocessed. During this window, both the previous and new bucket data may exist concurrently.
## Troubleshooting Strategies
### 1. Identify Timing
Use [Usage Metrics](/maintenance-ops/monitoring-and-alerting#usage-metrics) to pinpoint usage spikes.
### 2. Review Logs
Use [Instance Logs](/maintenance-ops/monitoring-and-alerting#instance-logs) to review sync service logs during the spike(s). In the **Search** input, query `"sync stream complete"` to surface entries showing how many operations synced, the size of data transferred, and which clients/users were involved.
Narrow the results with structured filters, either by typing them in the **Search** input (e.g. `user:`, `rid:`, `error:PSYNC_S2001`), by using the **Property filters** button next to the search input, or by clicking a metadata pill on any log entry and choosing **Add filter**.
You may need to scroll to load more logs. To get the filtered logs as a file, click the **Export** (download) button in the top-right of the logs toolbar. It exports the currently visible logs to CSV.
### 3. Compare Metrics
Use the [Sync Diagnostics Client](https://github.com/powersync-ja/powersync-js/tree/main/tools/diagnostics-app) to compare total rows vs. operations synced to the user device. If you're seeing significantly more operations than rows, you might benefit from [defragmentation](/maintenance-ops/compacting-buckets#defragmenting).
### 4. Detailed Sync Operations
Use the [test-client](https://github.com/powersync-ja/powersync-service/blob/main/test-client/src/bin.ts)'s `fetch-operations` command with the `--raw` flag:
```bash theme={null}
node dist/bin.js fetch-operations --raw --token your-jwt --endpoint https://12345.powersync.journeyapps.com
```
If you generate the token from a config that uses `!env PS_*` tags, the test-client reads them from your shell; pass `--env path/to/.env` to load them from a file instead.
This returns the individual operations for a user in JSON. Example response:
```bash theme={null}
{
"by_user[\"0b32a7cb-26fb-4993-9c60-9291a430337e\"]": [
{
"op_id": "0",
"op": "CLEAR",
"checksum": 2082236117
},
{
"op_id": "1145383",
"op": "PUT",
"object_type": "todos",
"object_id": "69688ea0-d3f6-46c9-81a2-cdbe54eeb54d",
"checksum": 3246341700,
"subkey": "6752f74f8176c1b5ba851480/fcb2cd3c-dcef-5c46-8b17-7b83d31fda2b",
"data": "{\"id\":\"69688ea0-d3f6-46c9-81a2-cdbe54eeb54d\",\"created_at\":\"2024-09-16 10:16:35.352665Z\",\"description\":\"Buy groceries\",\"user_id\":\"0b32a7cb-26fb-4993-9c60-9291a430337e\"}"
},
{
"op_id": "1145387",
"op": "PUT",
"object_type": "todos",
"object_id": "7e4a4550-af3b-4876-a01a-10dc0084f0a6",
"checksum": 1103209588,
"subkey": "6752f74f8176c1b5ba851480/75bbc91d-cfc9-5b22-9f85-ea31a8720bf8",
"data": "{\"id\":\"7e4a4550-af3b-4876-a01a-10dc0084f0a6\",\"created_at\":\"2024-10-07 16:17:37Z\",\"description\":\"Plant tomatoes\",\"user_id\":\"0b32a7cb-26fb-4993-9c60-9291a430337e\"}"
}
]
}
```
## Accident Forgiveness
Accidentally ran up a high bill? No problem — we've got your back. Reach out to us at [support@powersync.com](mailto:support@powersync.com) and we'll work with you to resolve the issue and prevent it from happening again.
You may need to scroll to load more logs. To get the filtered logs as a file, click the **Export** (download) button in the top-right of the logs toolbar. It exports the currently visible logs to CSV.
3. **Compare operations vs row sizes:**
If operations are high and size scales with it, you likely have tables being updated frequently, or a large operations history has built up. See our [defragmenting guide](/maintenance-ops/compacting-buckets#defragmenting). If operations are moderate but size is large, your rows likely contain large data (e.g., large JSON columns or blobs).
4. **Identify large payloads in your database:**
Check typical row sizes for frequently updated tables and look for large columns (e.g., long TEXT/JSON fields, embedded files).
5. **Consider recent maintenance and app changes:**
Defragmentation and Sync Rule deploys cause existing clients to re-sync content, temporarily increasing data synced. New app installs trigger initial full sync, so expect higher usage when onboarding new sets of users.
### Data Hosted
Your hosted data size may be larger than your source database size because it includes the history of all operations on data in buckets. This can be bigger than the source since it includes history, and one row can be in multiple buckets.
Data hosted can temporarily spike during Sync Rule deployments and defragmentation because buckets are reprocessed. During this window, both the previous and new bucket data may exist concurrently.
## Troubleshooting Strategies
### 1. Identify Timing
Use [Usage Metrics](/maintenance-ops/monitoring-and-alerting#usage-metrics) to pinpoint usage spikes.
### 2. Review Logs
Use [Instance Logs](/maintenance-ops/monitoring-and-alerting#instance-logs) to review sync service logs during the spike(s). In the **Search** input, query `"sync stream complete"` to surface entries showing how many operations synced, the size of data transferred, and which clients/users were involved.
Narrow the results with structured filters, either by typing them in the **Search** input (e.g. `user:`, `rid:`, `error:PSYNC_S2001`), by using the **Property filters** button next to the search input, or by clicking a metadata pill on any log entry and choosing **Add filter**.
You may need to scroll to load more logs. To get the filtered logs as a file, click the **Export** (download) button in the top-right of the logs toolbar. It exports the currently visible logs to CSV.
### 3. Compare Metrics
Use the [Sync Diagnostics Client](https://github.com/powersync-ja/powersync-js/tree/main/tools/diagnostics-app) to compare total rows vs. operations synced to the user device. If you're seeing significantly more operations than rows, you might benefit from [defragmentation](/maintenance-ops/compacting-buckets#defragmenting).
### 4. Detailed Sync Operations
Use the [test-client](https://github.com/powersync-ja/powersync-service/blob/main/test-client/src/bin.ts)'s `fetch-operations` command with the `--raw` flag:
```bash theme={null}
node dist/bin.js fetch-operations --raw --token your-jwt --endpoint https://12345.powersync.journeyapps.com
```
If you generate the token from a config that uses `!env PS_*` tags, the test-client reads them from your shell; pass `--env path/to/.env` to load them from a file instead.
This returns the individual operations for a user in JSON. Example response:
```bash theme={null}
{
"by_user[\"0b32a7cb-26fb-4993-9c60-9291a430337e\"]": [
{
"op_id": "0",
"op": "CLEAR",
"checksum": 2082236117
},
{
"op_id": "1145383",
"op": "PUT",
"object_type": "todos",
"object_id": "69688ea0-d3f6-46c9-81a2-cdbe54eeb54d",
"checksum": 3246341700,
"subkey": "6752f74f8176c1b5ba851480/fcb2cd3c-dcef-5c46-8b17-7b83d31fda2b",
"data": "{\"id\":\"69688ea0-d3f6-46c9-81a2-cdbe54eeb54d\",\"created_at\":\"2024-09-16 10:16:35.352665Z\",\"description\":\"Buy groceries\",\"user_id\":\"0b32a7cb-26fb-4993-9c60-9291a430337e\"}"
},
{
"op_id": "1145387",
"op": "PUT",
"object_type": "todos",
"object_id": "7e4a4550-af3b-4876-a01a-10dc0084f0a6",
"checksum": 1103209588,
"subkey": "6752f74f8176c1b5ba851480/75bbc91d-cfc9-5b22-9f85-ea31a8720bf8",
"data": "{\"id\":\"7e4a4550-af3b-4876-a01a-10dc0084f0a6\",\"created_at\":\"2024-10-07 16:17:37Z\",\"description\":\"Plant tomatoes\",\"user_id\":\"0b32a7cb-26fb-4993-9c60-9291a430337e\"}"
}
]
}
```
## Accident Forgiveness
Accidentally ran up a high bill? No problem — we've got your back. Reach out to us at [support@powersync.com](mailto:support@powersync.com) and we'll work with you to resolve the issue and prevent it from happening again.