> ## Documentation Index
> Fetch the complete documentation index at: https://docs.powersync.com/llms.txt
> Use this file to discover all available pages before exploring further.
# Monitoring and Alerting
> Set up monitoring and alerting for PowerSync Cloud instances to track replication and sync health, connection status, and common errors.
You can monitor activity and alert on issues and usage for your PowerSync Cloud instance(s):
* **Monitor Usage**: View time-series and aggregated usage data with [Usage Metrics](#usage-metrics)
* **Monitor Service and Replication Activity**: Track your PowerSync Service and replication logs with [Instance Logs](#instance-logs)
* **Configure Alerts**: Set up alerts for connection or replication issues or usage activity \*
* Includes [Issue Alerts](#issue-alerts) and/or [Usage Alerts](#usage-alerts)
* **Alert Notifications**: Set up [Email notifications](#email-notifications) or [Webhooks](#webhooks) to report events (like issue or usage alerts) to external systems \*
These features can assist with troubleshooting common issues (e.g. replication errors due to a logical replication slot problem), investigating usage spikes, or being notified when usage exceeds a specific threshold.
Investigating replication lag specifically? See [Replication Lag](/maintenance-ops/replication-lag) for what it is, how to monitor it, and common causes.
\* The availability of these features depends on your PowerSync Cloud plan. See the table below for a summary. More details are provided further below.
### Summary of Feature Availability (by PowerSync Cloud Plan)
Monitoring and alerting functionality varies by [PowerSync Cloud plan](https://www.powersync.com/pricing). This table provides a summary of availability:
| Feature | Free | Pro | Team & Enterprise |
| ------------------------ | ------------- | ------------------------ | ------------------------ |
| **Usage Metrics** | Available | Available | Available |
| **Instance Logs** | Available | Available | Available |
| **Log retention period** | 24 hours | 7 days | 30 days |
| **Issue Alerts** | Available | Available | Available |
| **Usage Alerts** | Not available | Not available | Available |
| **Alert Notifications** | - Email | - Email
- Webhooks | - Email
- Webhooks |
**Self-hosting PowerSync**
Similar monitoring and alerting functionality is planned for PowerSync Open Edition users and Enterprise Self-Hosted customers.
For Open Edition users, alerting APIs are currently available in an early access release. For Enterprise Self-Hosted customers we are planning a full alerting service that includes customizable alerts and webhook integrations.
Until this is available, please chat to us on our [Discord](https://discord.gg/powersync) to discuss your use case or any questions.
## Usage Metrics
View time-series and aggregated usage data for your PowerSync instance(s), including storage size, concurrent connections, and synced data and operations. This data lets you monitor activity, spot patterns or spikes, and budget while tracking your position within our [Cloud pricing plans](https://www.powersync.com/pricing).
### View Usage Metrics
Access usage metrics in the [PowerSync Dashboard](https://dashboard.powersync.com/). Select your project and instance and go to the **Metrics** view:
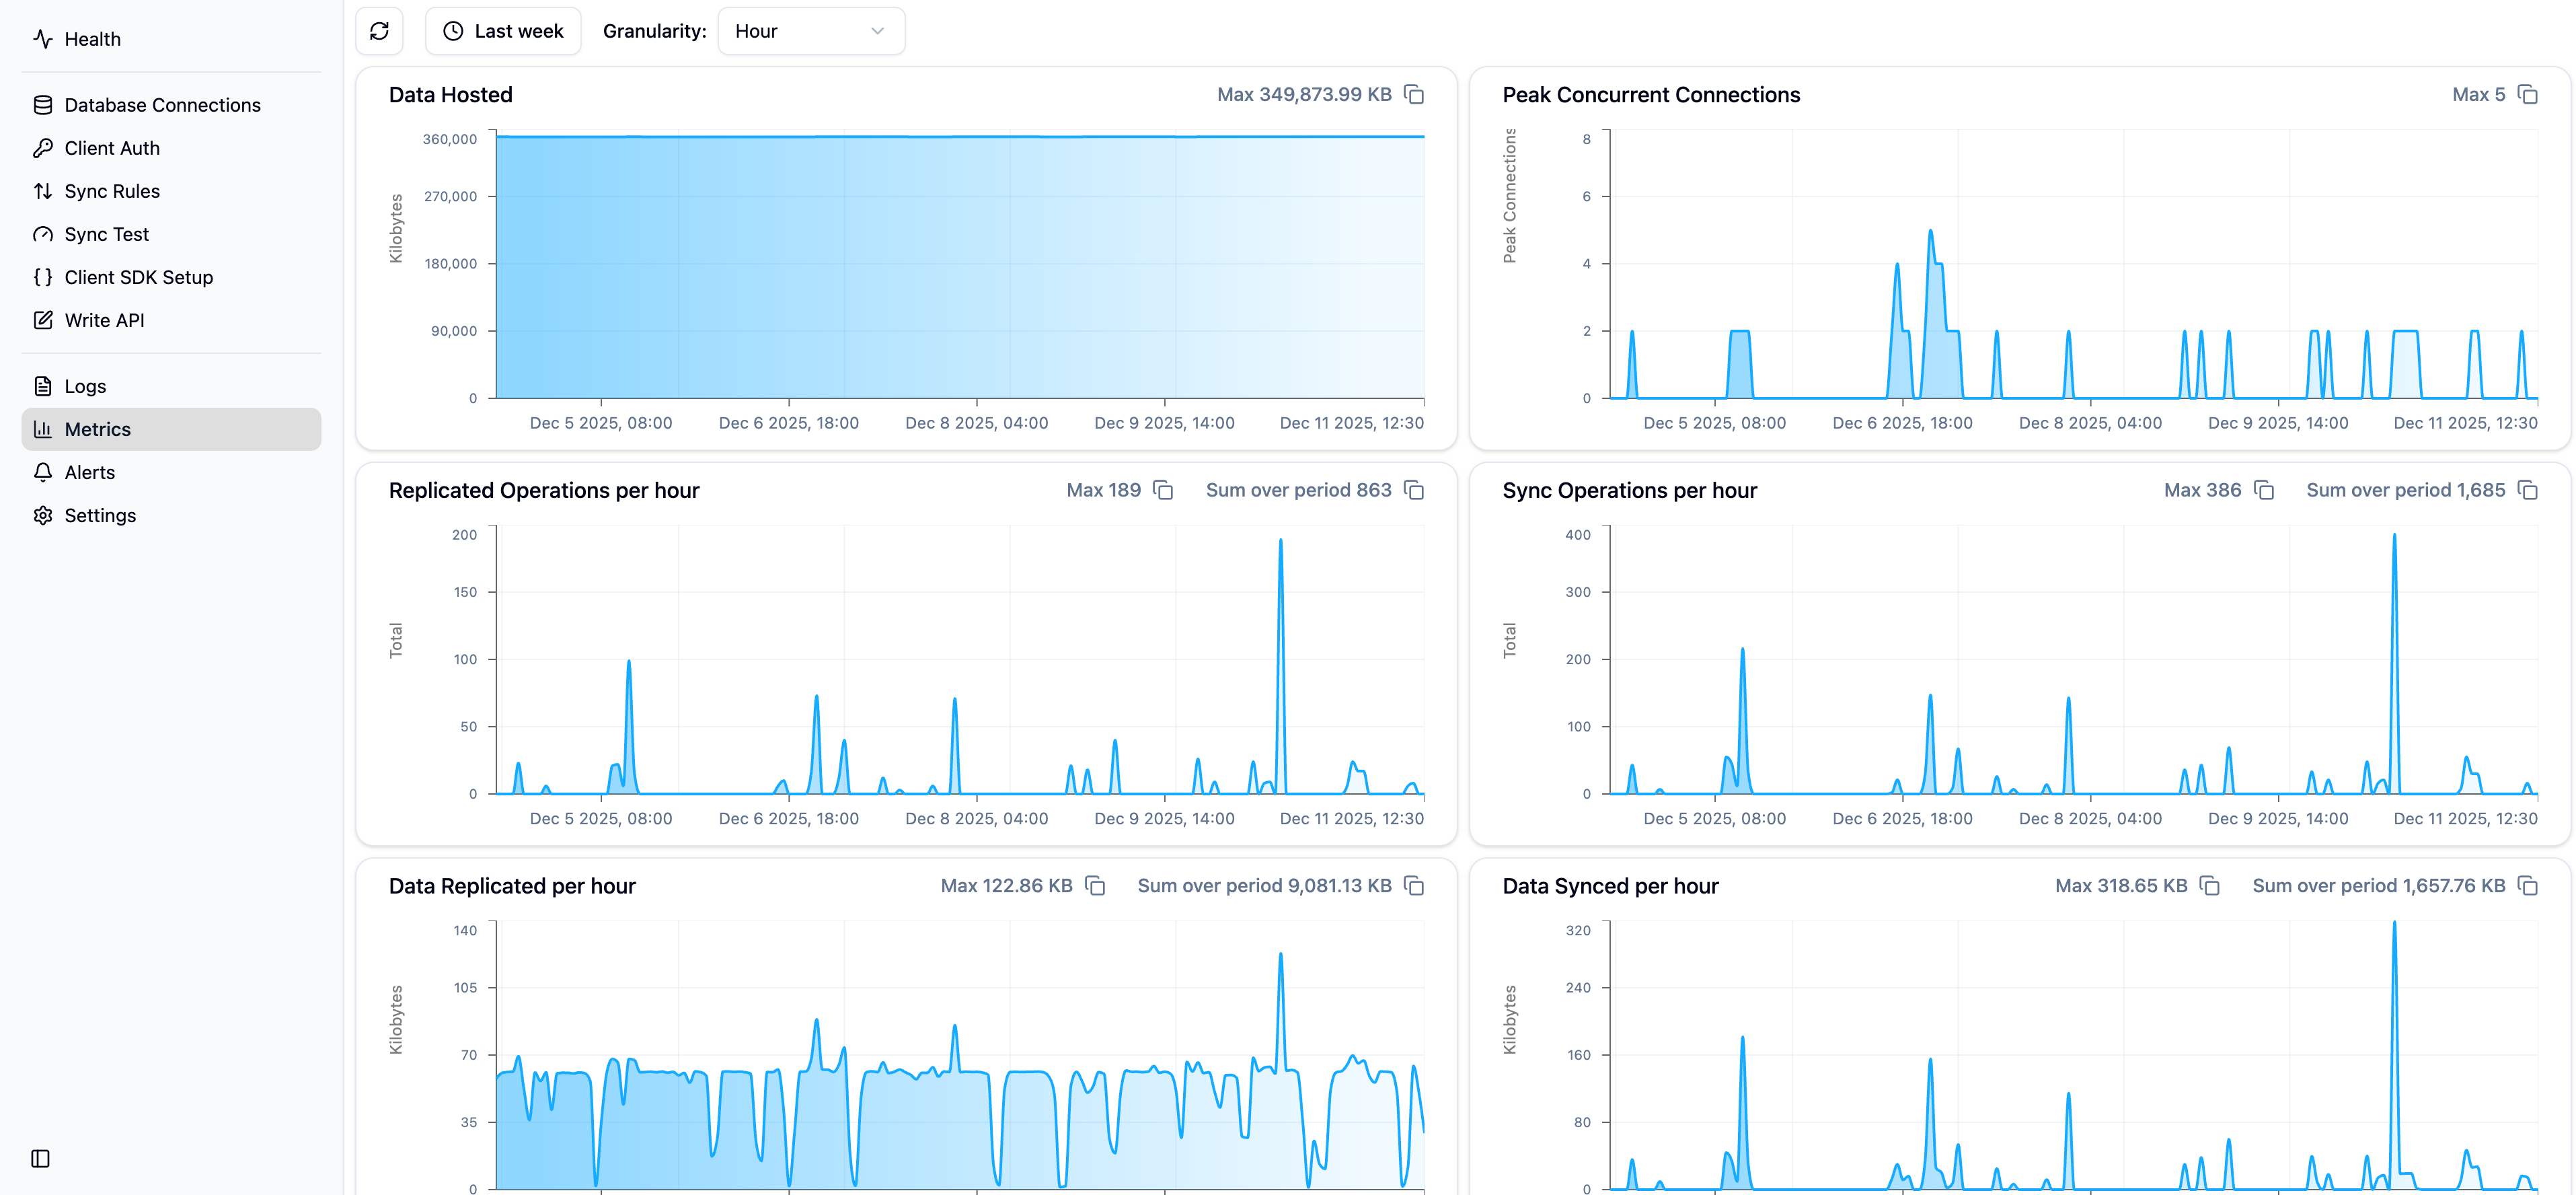 You have following options:
* **Filter options**: data by time range.
* **Granularity**: See data in a daily, hourly or minute granularity.
* **Aggregates**: View and copy aggregates for each usage metric.
This usage data is also available programmatically via APIs in an early access release. Chat to us on our [Discord](https://discord.gg/powersync) if you require details.
## Instance Logs
You can review logs for your PowerSync instance(s) to troubleshoot replication or sync service issues. Logs capture activity from the PowerSync Service and Replicator processes.
* **Sync & API logs**: Reflect sync processes from the PowerSync Service to clients.
* **Replicator logs**: Reflect replication activity from your source database to the PowerSync Service.
**Availability**
The log retention period varies by plan:
* **Free** plan: Logs from the last 24 hours
* **Pro** plan: Logs from the last 7 days
* **Team & Enterprise** plans: Logs from the last 30 days
### View Instance Logs
Access instance logs through the [PowerSync Dashboard](https://dashboard.powersync.com/). Select your project and instance and go to the **Logs** view:
Log search is intended for ad-hoc investigation, not persistent monitoring or alerting. We may apply rate limits where sustained heavy usage occurs.
You have following options:
* **Filter options**: data by time range.
* **Granularity**: See data in a daily, hourly or minute granularity.
* **Aggregates**: View and copy aggregates for each usage metric.
This usage data is also available programmatically via APIs in an early access release. Chat to us on our [Discord](https://discord.gg/powersync) if you require details.
## Instance Logs
You can review logs for your PowerSync instance(s) to troubleshoot replication or sync service issues. Logs capture activity from the PowerSync Service and Replicator processes.
* **Sync & API logs**: Reflect sync processes from the PowerSync Service to clients.
* **Replicator logs**: Reflect replication activity from your source database to the PowerSync Service.
**Availability**
The log retention period varies by plan:
* **Free** plan: Logs from the last 24 hours
* **Pro** plan: Logs from the last 7 days
* **Team & Enterprise** plans: Logs from the last 30 days
### View Instance Logs
Access instance logs through the [PowerSync Dashboard](https://dashboard.powersync.com/). Select your project and instance and go to the **Logs** view:
Log search is intended for ad-hoc investigation, not persistent monitoring or alerting. We may apply rate limits where sustained heavy usage occurs.
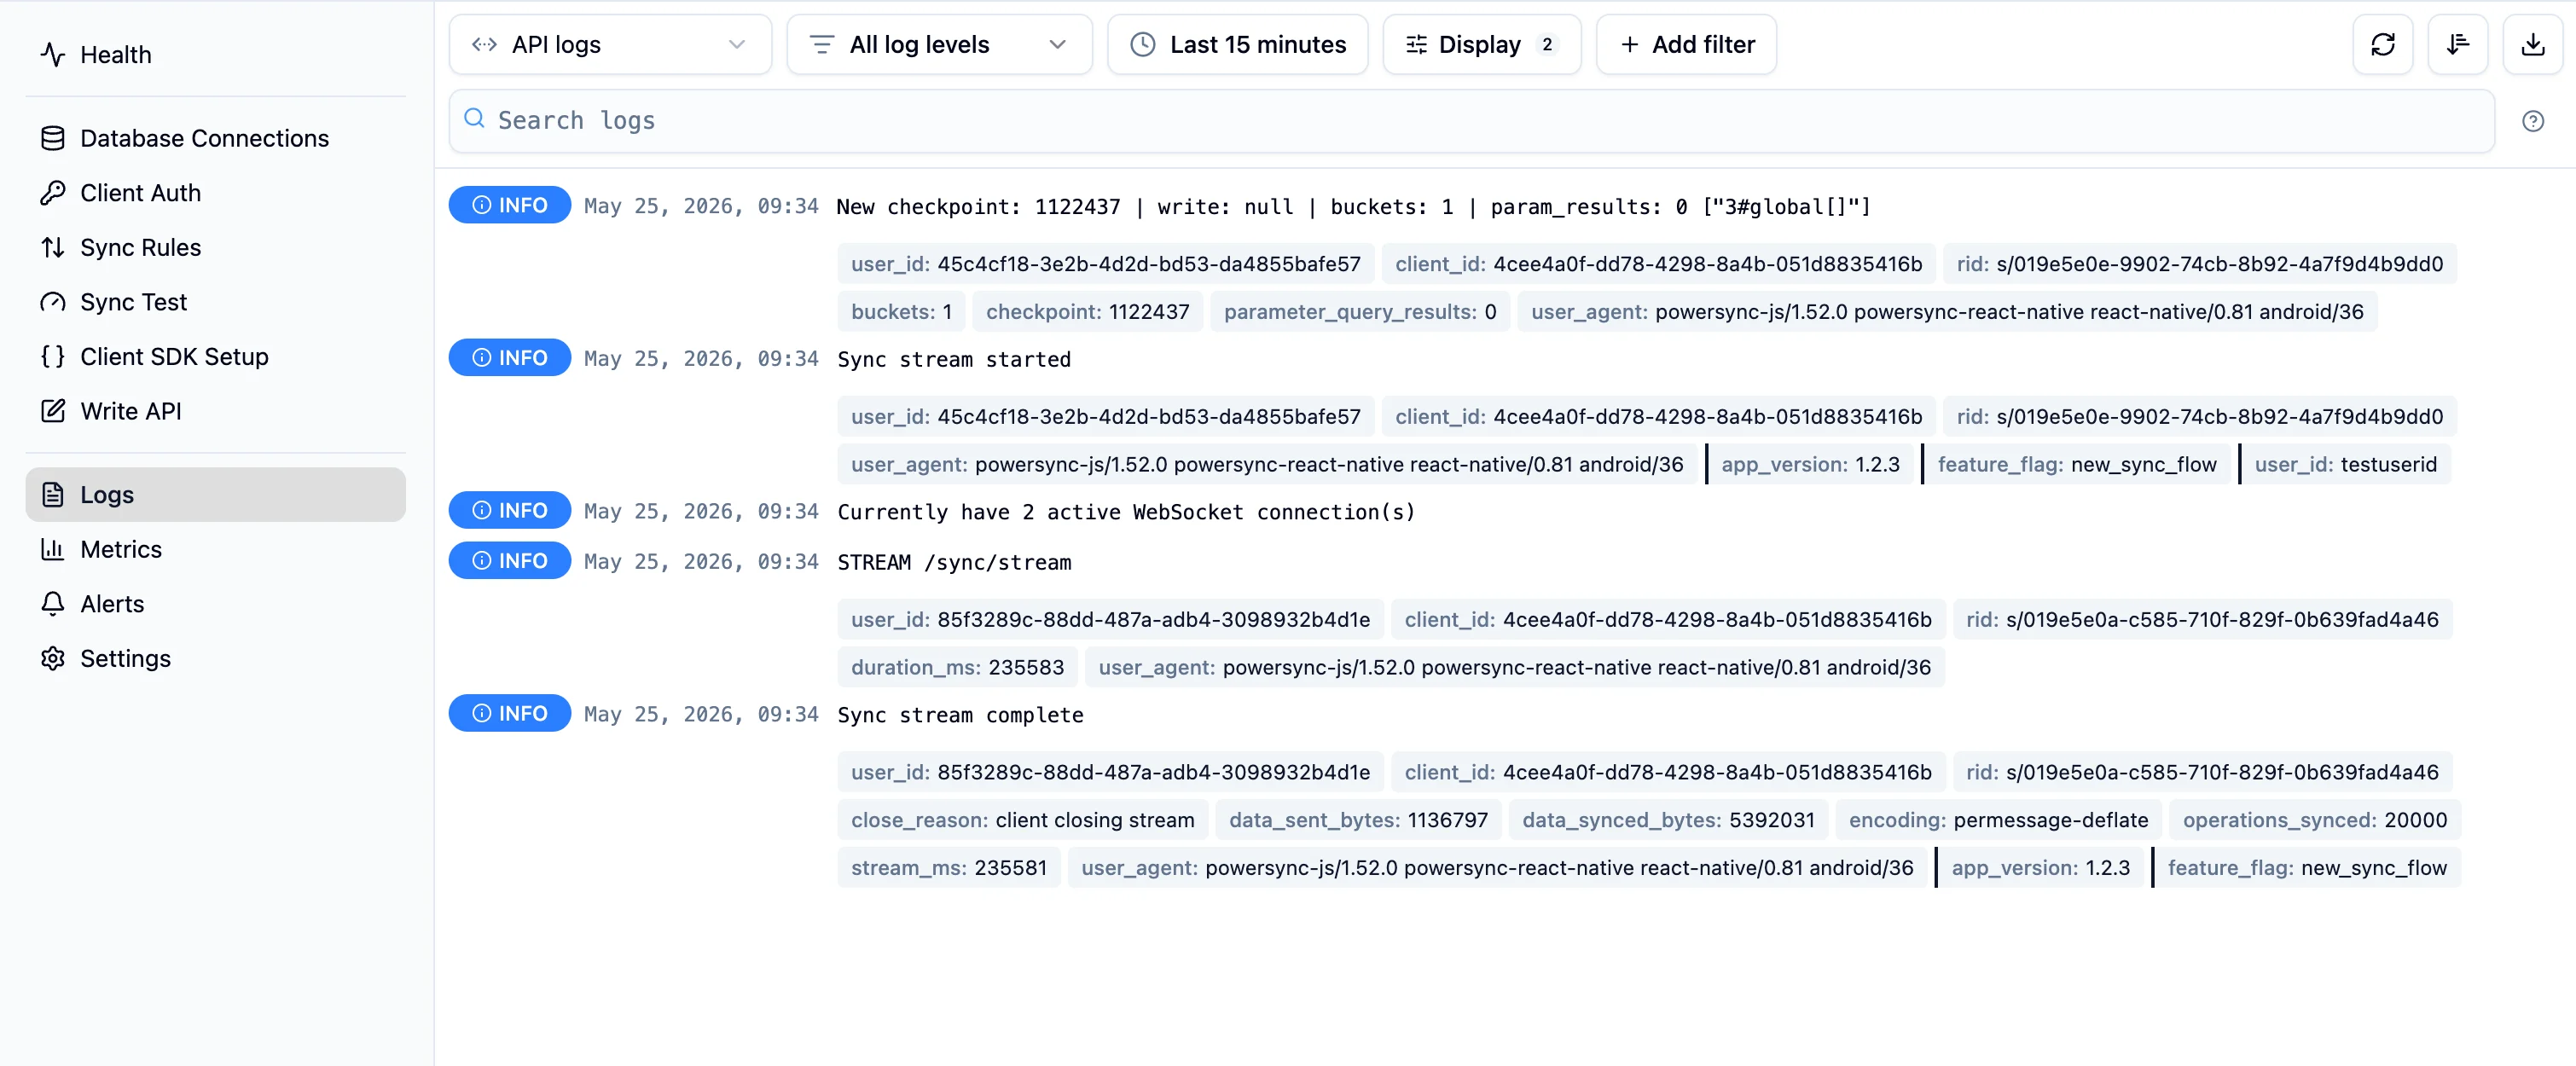 You can manage logs with the following options:
* **Log Type**: Switch between **Sync & API logs** (from the PowerSync Service API container, which handles streaming sync connections as well as other API calls) and **Replication logs**.
* **Log Levels**: Show or hide `Info`, `Error`, `Warn`, and `Debug` entries.
* **Time Range**: Limit results to a relative window (last 15 minutes, last hour, etc.) or a custom range. The available window depends on your plan's retention period. You can also click the timestamp on any log entry to set it as the start or end of the time range.
* **Sort Order**: Sort by newest or oldest first.
* **Display Options**: Show metadata pills on each entry, show stack traces for errors, and tail logs in real time.
Hover over a log entry to reveal a button that copies the full log event as JSON.
### Search and Filter Logs
You can manage logs with the following options:
* **Log Type**: Switch between **Sync & API logs** (from the PowerSync Service API container, which handles streaming sync connections as well as other API calls) and **Replication logs**.
* **Log Levels**: Show or hide `Info`, `Error`, `Warn`, and `Debug` entries.
* **Time Range**: Limit results to a relative window (last 15 minutes, last hour, etc.) or a custom range. The available window depends on your plan's retention period. You can also click the timestamp on any log entry to set it as the start or end of the time range.
* **Sort Order**: Sort by newest or oldest first.
* **Display Options**: Show metadata pills on each entry, show stack traces for errors, and tail logs in real time.
Hover over a log entry to reveal a button that copies the full log event as JSON.
### Search and Filter Logs
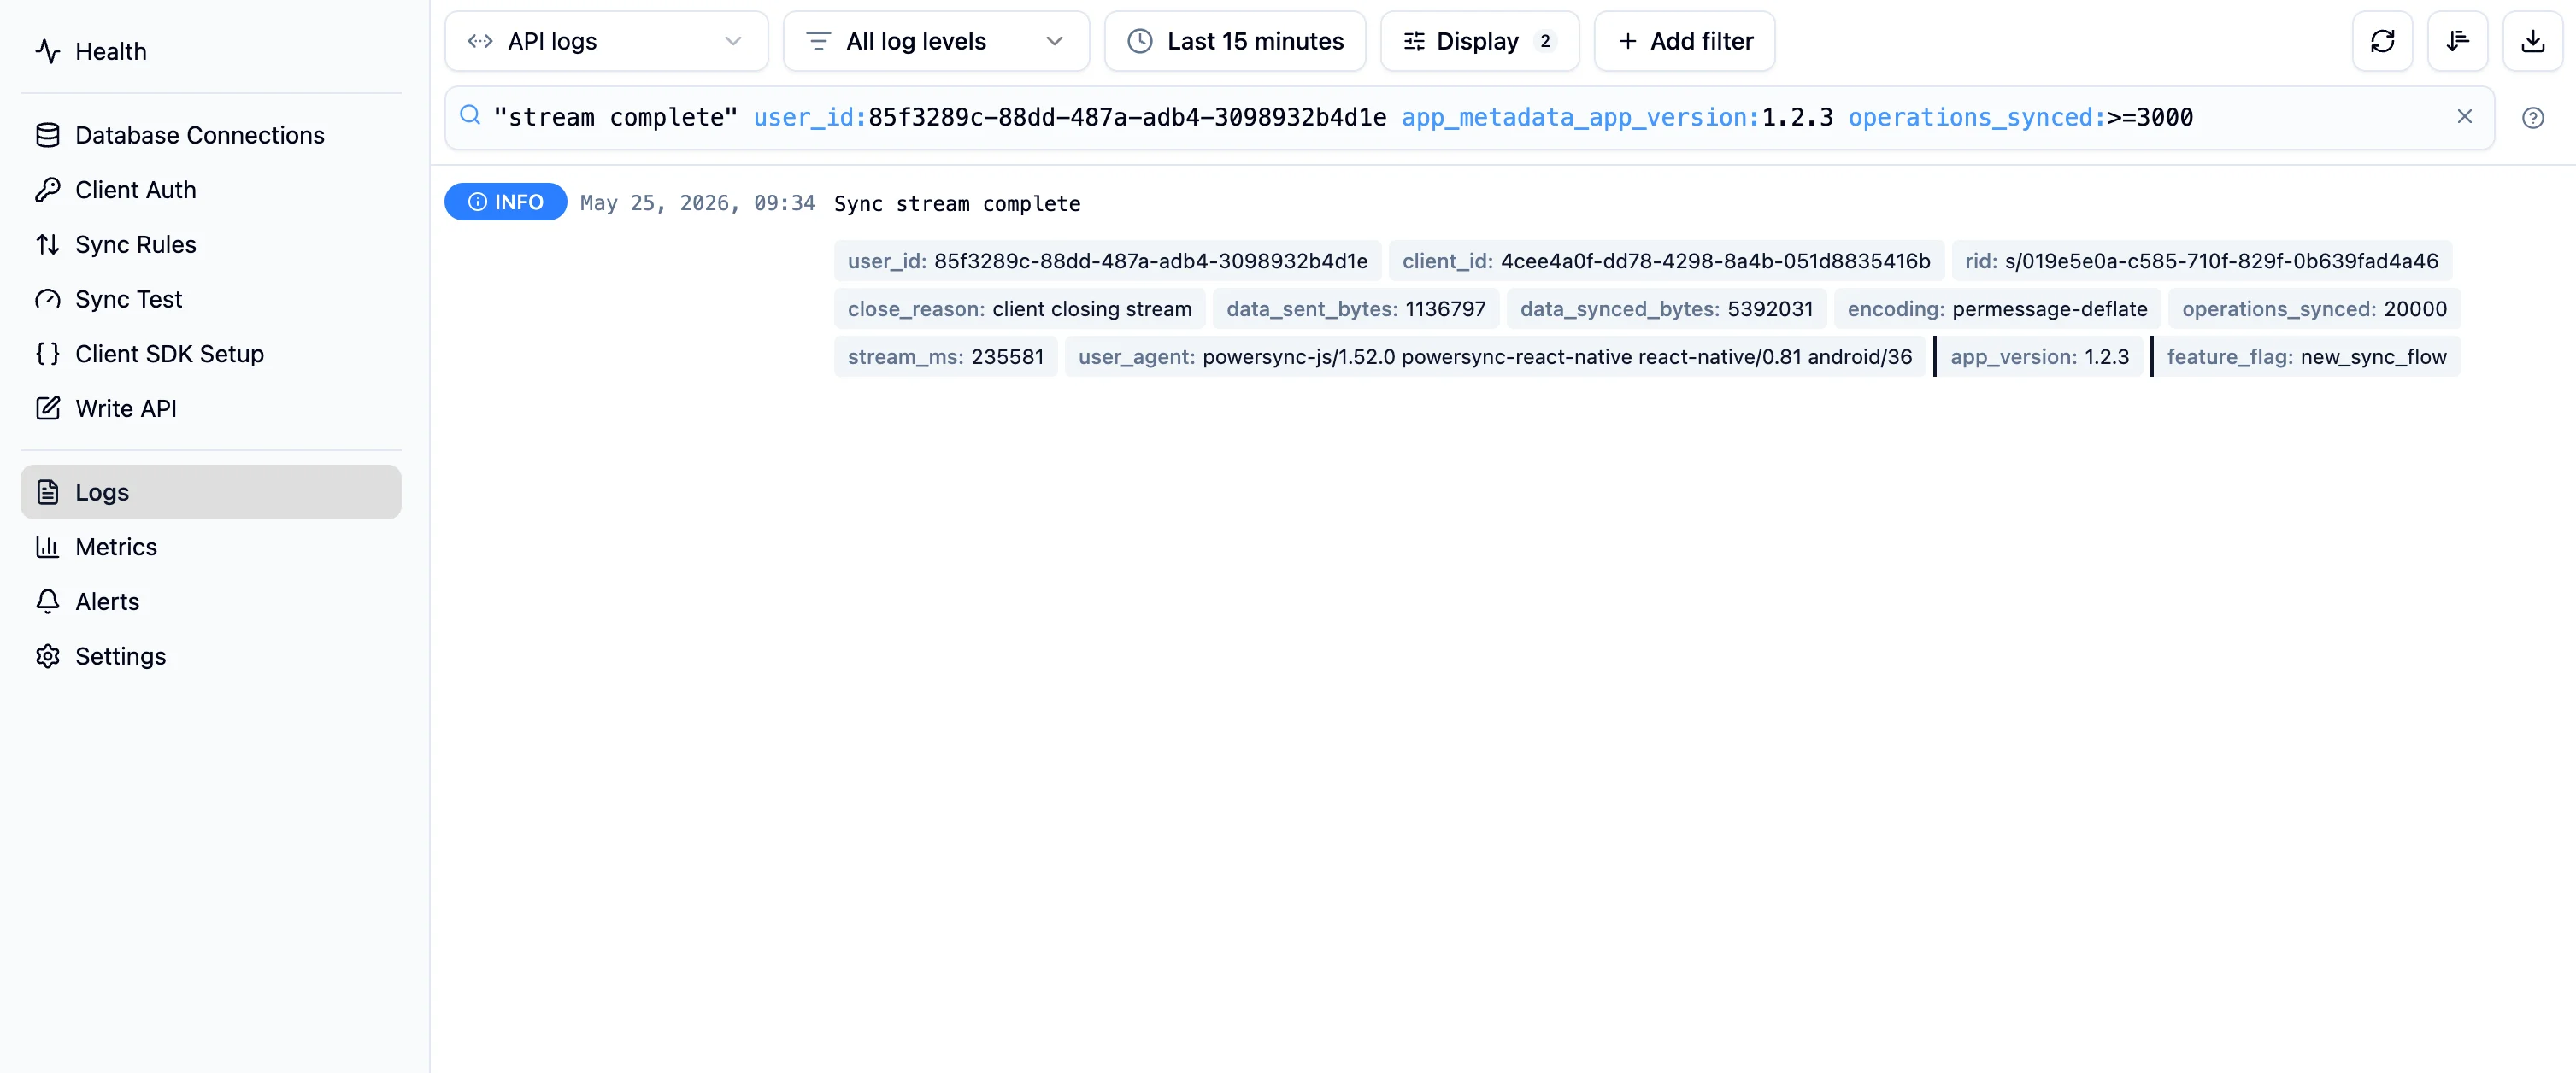 The **Search** input above the log list accepts free-text terms and structured `alias:value` filters. Type a query and the results update as you type.
#### Free-Text Search
Type bare words to match anywhere in the raw log entry. Matching is case-insensitive, and every word must match (AND):
```
checkpoint stream
```
Wrap a phrase in double quotes to match the exact sequence:
```
"sync stream complete"
```
Free-text search matches against the full entry, including the message text and every metadata property. This is independent of the **Display Options** toggle that controls whether metadata pills are rendered, so a match on a metadata value still returns the entry even if the pills in the UI are hidden.
#### Property Filters
Use `alias:value` to filter on a specific property. Unlike free-text search, a property filter only matches the named property, not the rest of the log entry. Repeating the same alias matches any of the listed values (OR within a property, AND across properties):
```
user_id: user_id: error:PSYNC_S2001
```
Quote values that contain spaces:
```
close_reason:"client closing stream"
```
The following aliases are supported for Sync & API logs. For most properties the alias matches the canonical property name; `error` and `lag` keep a short form because their underlying paths are awkward to type. You can also type the short aliases shown in parentheses; they are normalised to the canonical name on submit.
| Alias | Property | Description |
| ------------------------- | -------------- | ------------------------------------------------------------------------ |
| `user_id` (`user`) | `user_id` | The authenticated user ID for the sync session. |
| `client_id` (`client`) | `client_id` | The client device ID. |
| `rid` (`request`) | `rid` | The request ID. Matches a started or complete entry. |
| `error` | `error_code` | A specific PSYNC error code (see [Error Codes](/debugging/error-codes)). |
| `close_reason` (`reason`) | `close_reason` | Why the sync session closed. |
For Replication logs:
| Alias | Property | Description |
| ----- | ----------------- | ----------------------------------------------------------------------- |
| `lag` | `replication_lag` | Replication lag in seconds. Used with a numeric comparison (see below). |
#### Numeric Comparisons
The `lag` filter accepts `>`, `>=`, `<`, `<=`, and `=`:
```
lag:>=5
```
Only one numeric comparison is allowed per property. Combining `lag:>5 lag:<10` is rejected.
#### Excluding Results
Prefix a term or filter with `-` to exclude matching entries. This is useful for hiding known-noisy errors while triaging:
```
-error:PSYNC_S2106
```
Exclusion works with both syntaxes:
* `-alias:value` hides entries where the property matches the value. Repeating a negated alias hides every listed value: `-user_id:123 -user_id:456` hides both users.
* `-word` hides entries containing the text anywhere in the entry. Quote phrases: `-"token expired"`.
Only an unquoted `-` at the start of a term excludes. A hyphen inside a term matches literally (`powersync-js`), and quoting keeps a leading hyphen literal: `"-foo"` finds entries containing `-foo` rather than excluding `foo`.
Numeric comparisons **cannot** be negated. You should use the inverse comparison instead: `lag:<5` rather than `-lag:>=5`.
#### Filtering on Other Properties
The **Property filters** button in the toolbar lists the aliases for the active log type. Log entries can contain many additional properties, and you can filter on any of them using `alias:value` syntax directly in the search bar. For example:
```
buckets:1
```
Filters are evaluated against the matching property on each log entry.
You can also add a metadata property as a filter directly from any log entry. Enable the **Metadata** display option to render each entry's structured properties as pills. Click a pill to open its menu and choose **Add filter**:
This is the quickest way to filter on properties you spot in the logs without remembering their names.
#### Combined Example
You can mix free-text terms, known aliases, unknown properties, and exclusions in a single query:
```
checkpoint sync user_id:123 checkpoint:>=1224 -error:PSYNC_S2106
```
This matches entries containing both `checkpoint` and `sync` in the message, with `user_id` equal to `123` and a `checkpoint` property greater than or equal to `1224`, excluding entries with error code `PSYNC_S2106`.
### Export Logs
Click the **Download** button on the right side of the toolbar to export the currently visible log entries to a CSV file. The export reflects the active log type, time range, log levels, and search query, so you can narrow the result set before downloading.
The CSV uses fixed columns for the most useful fields and collapses anything else into a trailing `metadata` JSON column:
| Column | Description |
| -------------- | ---------------------------------------------------------------- |
| `timestamp` | ISO 8601 timestamp of the entry. |
| `level` | Log level (`info`, `error`, `warn`, `debug`). |
| `message` | Formatted log message. |
| `user_id` | Authenticated user ID (Sync & API logs). |
| `client_id` | Client device ID (Sync & API logs). |
| `rid` | Request ID (Sync & API logs). |
| `error_code` | PSYNC error code if the entry has one. |
| `close_reason` | Close reason for sync session entries. |
| `metadata` | JSON object containing every other top-level field on the entry. |
The file is named `powersync-logs--.csv` where `` is the export time in UTC.
The export only includes entries currently loaded in the view. If you have not scrolled to load more entries with **Load More**, those entries are not included in the CSV.
### Correlating Sync Sessions
To find a specific user's session in the Sync & API logs, search for their `user_id`:
```
user_id:
```
Two events describe each sync session:
* **Sync stream started**: logged when the client connects. Fields include `user_id`, `client_id`, `app_metadata` (if set), `client_params`, `user_agent`, and `rid` (request id).
* **Sync stream complete**: logged when the session ends. Fields include `user_id`, `client_id`, `app_metadata` (if set), `operations_synced`, `operation_counts` (broken down by `put`, `remove`, `move`, `clear`), `data_synced_bytes`, `data_sent_bytes`, `stream_ms` (session duration), `close_reason`, and `rid`.
Both events share the same `rid`, so you can match a started/complete pair for a single session by searching for it:
```
rid:
```
For diagnosing sync latency, see [Diagnosing Sync Latency](/debugging/troubleshooting#diagnosing-sync-latency).
## Custom Metadata in Sync Logs
Custom metadata in sync logs allows clients to attach additional context to their PowerSync connection for improved observability and analytics. This metadata appears in the Sync & API logs, making it easier to track, debug, and analyze sync behavior across your app. For example, you can tag connections with app version, feature flags, or business context.
### How to Use Custom Metadata
You can specify application metadata when calling `PowerSyncDatabase.connect()`. To update the metadata, reconnect with new metadata values.
**Version compatibility**: This feature requires JavaScript/Web SDK v1.30.0+, React Native SDK v1.28.0+, Node.js SDK v0.15.0+, or Capacitor SDK v0.2.0+, and PowerSync Service v1.17.0+.
```javascript theme={null}
import { PowerSyncDatabase } from '@powersync/web'; // Update this to the appropriate SDK package
const powerSync = new PowerSyncDatabase({
schema: AppSchema,
database: {
dbFilename: 'powersync.db'
}
});
// Set custom metadata when connecting
powerSync.connect(connector, {
appMetadata: {
app_version: '1.2.3',
feature_flag: 'new_sync_flow'
}
});
```
**Version compatibility**: This feature requires Dart/Flutter SDK v1.17.0+ and PowerSync Service v1.17.0+.
```dart theme={null}
import 'package:powersync/powersync.dart';
final powerSync = PowerSyncDatabase(
schema: AppSchema,
path: 'powersync.db'
);
await powerSync.initialize();
// Set custom metadata when connecting
const options = SyncOptions(
appMetadata: {
'app_version': '1.2.3',
'feature_flag': 'new_sync_flow'
}
);
powerSync.connect(
connector: MyConnector(),
options: options
);
```
**Version compatibility**: This feature requires Kotlin SDK v1.10.0+ and PowerSync Service v1.17.0+.
```kotlin theme={null}
import com.powersync.DatabaseDriverFactory
import com.powersync.PowerSyncDatabase
// Android
val driverFactory = DatabaseDriverFactory(this)
// iOS & Desktop
// val driverFactory = DatabaseDriverFactory()
val powerSync = PowerSyncDatabase({
factory: driverFactory,
schema: AppSchema,
dbFilename: "powersync.db"
})
// Set custom metadata when connecting
powerSync.connect(
connector = MyConnector(),
appMetadata = mapOf(
"app_version" to "1.2.3",
"feature_flag" to "new_sync_flow"
)
)
```
**Version compatibility**: This feature requires Swift SDK v1.9.0+ and PowerSync Service v1.17.0+.
```swift theme={null}
import PowerSync
let schema = AppSchema
let connector = Connector() // This connector must conform to PowerSyncBackendConnector
let powerSync = PowerSyncDatabase(
schema: schema,
dbFilename: "powersync.db"
)
// Set custom metadata when connecting
try await powerSync.connect(
connector: connector,
options: ConnectOptions(
appMetadata: [
"app_version": "1.2.3",
"feature_flag": "new_sync_flow"
]
)
)
```
**Version compatibility**: This feature requires .NET SDK v0.0.6-alpha.1+ and PowerSync Service v1.17.0+.
```csharp theme={null}
using PowerSync.Common.Client;
using PowerSync.Common.Client.Sync.Stream;
var powerSync = new PowerSyncDatabase(new PowerSyncDatabaseOptions
{
Database = new SQLOpenOptions { DbFilename = "powersync.db" },
Schema = AppSchema.PowerSyncSchema,
});
await powerSync.Init();
// Set custom metadata when connecting
await powerSync.Connect(
connector: new MyConnector(),
options: new PowerSyncConnectionOptions
{
AppMetadata = new Dictionary
{
{ "app_version", "1.2.3" },
{ "feature_flag", "new_sync_flow" }
}
}
);
```
Example not yet available.
### View Custom Metadata in Logs
Custom metadata appears in the **Sync & API logs** section of the [PowerSync Dashboard](https://dashboard.powersync.com/). Navigate to your project and instance, then go to the **Logs** view. The metadata is included in **Sync stream started** and **Sync stream complete** log entries.
Make sure the **Metadata** checkbox is enabled in the logs view to see custom metadata in log entries.
To filter on a custom metadata key in the search bar, prefix it with `app_metadata_`. For example, for `{ region: 'us-east' }`:
```
app_metadata_region:us-east
```
The same prefix applies when clicking **Add filter** on a custom metadata pill.
Note the following when using custom metadata:
* Keep metadata values concise. `app_metadata` is limited to 20 keys, with each string value capped at 100 characters.
* Avoid including sensitive information in metadata as it will appear in logs.
* Metadata is set per connection. Reconnect with new metadata when user context or app state changes (e.g., feature flags).
## Issue Alerts
Issue alerts capture potential problems with your instance, such as connection or replication issues.
**Availability**
* Issue alerts are available on all Cloud plans.
### Configure Issue Alerts
Issue alerts are set up per instance. To set up a new alert, navigate to the **Alerts** section in the [PowerSync Dashboard](https://dashboard.powersync.com/) and click **Create Issue Alert**.
When creating or editing an issue alert, you can configure:
* **Alert Name**: Give your alert a descriptive name to help identify it
* **Issue Type**: Select the type of issue to monitor from the dropdown:
* **Database Connection Issue**: Trigger when there is a connection problem
* **Replication Issue**: Trigger when there is an issue with the replication process
* **Severity Levels**: Select which severity levels should trigger this alert:
* **Warning**: For non-critical issues
* **Fatal**: For critical issues that require immediate attention
**Important: Set Up Notification Rules**
Creating an issue alert only defines *what* to monitor. To actually receive notifications when alerts trigger, you must also set up [Email Rules](#email-notifications) or [Webhooks](#webhooks) and configure them to notify for "Issue alert state change" events. See the [Alert Notifications](#alert-notifications) section below.
## Usage Alerts
Usage alerts trigger when specific usage metrics exceed a defined threshold. This helps with troubleshooting usage spikes, or unexpected usage activity.
**Availability**
Usage alerts are available on **Team** and **Enterprise** plans.
### Configure Usage Alerts
Usage alerts are set up per instance. Navigate to the **Alerts** section in the [PowerSync Dashboard](https://dashboard.powersync.com/) and click **Create Usage Alert**.
When creating or editing a usage alert, you can configure:
* **Alert Name**: Give your alert a descriptive name to help identify it
* **Metric**: Select from the following usage metrics to monitor:
* Data Synced
* Data Replicated
* Operations Synced
* Operations Replicated
* Peak Concurrent Connections
* Storage Size
These metrics correspond to the data shown in the [Usage Metrics](#view-usage-metrics) workspace and align with the PowerSync Service parameters outlined in our [pricing](https://www.powersync.com/pricing).
* **Window**: The number of minutes to look back when evaluating usage. All usage data points within this time window are included when determining if the configured threshold has been crossed
* **Aggregation**: Select how to aggregate all data points within the window before comparing to the threshold:
* **Avg**: Calculate the average of all values
* **Max**: Use the highest value
* **Min**: Use the lowest value
* **Condition**: Set whether the alert triggers when usage goes **Above** or **Below** the specified threshold
* **Threshold Value**: The numeric limit for the selected metric (in bytes for size-based metrics; count for all other metrics)
**Important: Set Up Notification Rules**
Creating a usage alert only defines *what* to monitor. To actually receive notifications when alerts trigger, you must also set up [Email Rules](#email-notifications) or [Webhooks](#webhooks) and configure them to notify for "Usage alert state change" events. See the [Alert Notifications](#alert-notifications) section below.
## Alert Notifications
Set up notification rules to be informed of issue or usage alerts, as well as deploy state changes. PowerSync provides multiple notification methods that trigger both when an alert becomes active and when it returns to normal (indicating the monitored conditions are back within acceptable thresholds).
* **Email Rules**: Send alerts directly to your email address
* **Webhooks**: Notify external systems and services
**Availability**
* **Email Rules**: Available on all plans (**Free**, **Pro**, **Team** and **Enterprise**)
* **Webhooks**: Available on **Pro**, **Team** and **Enterprise** plans
### Email Rules
Email rules allow you to receive alerts directly to your email address when specific events occur in PowerSync.
#### Set Up Email Rules
Navigate to the **Alerts** section in the [PowerSync Dashboard](https://dashboard.powersync.com/) and scroll down to the **Notification Rules** section. Click **Create Email Rule** to set up email notifications.
Accounts on the Free plan are restricted to a single email rule; customers on paid plans can create an unlimited number of email rules.
When creating or editing an email rule, you can configure:
* **Recipient Email**: Specify the email address that will receive the notifications (required)
* **Event Triggers**: Select one or more of the following events to trigger the email notification:
* **Usage alert state change**: Fired when a usage alert changes between 'monitoring' and 'alerting' (a threshold has been crossed)
* **Issue alert state change**: Fired when an issue alert changes between 'monitoring' and 'alerting' (the instance has active issues)
* **Deploy state change**: Fired when an instance deploy starts, completes or fails. This includes deprovisioning an instance
* **Enabled**: Toggle to control whether the email rule is active
### Webhooks
Webhooks enable you to notify external systems when specific events occur in PowerSync.
#### Set Up Webhooks
Navigate to the **Alerts** section in the [PowerSync Dashboard](https://dashboard.powersync.com/) and scroll down to the **Notification Rules** section. Click **Create Webhook Rule** to set up webhook notifications.
When creating or editing a webhook rule, you can configure:
* **Webhook Endpoint (URL)**: Define the endpoint that will receive the webhook request (starting with `https://`) (required)
* **Event Triggers**: Select one or more of the following events to trigger the webhook:
* **Usage alert state change**: Fired when a usage alert changes between 'monitoring' and 'alerting' (a threshold has been crossed)
* **Issue alert state change**: Fired when an issue alert changes between 'monitoring' and 'alerting' (the instance has active issues)
* **Deploy state change**: Fired when an instance deploy starts, completes or fails. This includes deprovisioning an instance
* **Enabled**: Toggle to control whether the webhook rule is active
* **Retries**: Configure the number of retry attempts for failed webhook deliveries
After creating a webhook, a secret is automatically generated and copied to your clipboard. Store this secret since you'll need it to verify the webhook request signature.
### Webhook Signature Verification
Every webhook request contains an `x-journey-signature` header, which is a base64-encoded HMAC (Hash-based Message Authentication Code). To verify the request, you need to compute the HMAC using the shared secret that was generated when you created the webhook, and compare it to the value in the `x-journey-signature` header.
**JavaScript Example:**
```javascript theme={null}
import { createHmac } from 'crypto';
// Extract the signature from the request headers
const signature = request.header('x-journey-signature');
// Create an HMAC using your webhook secret and the request body
let verify = createHmac('sha256', '') // The secret provided during webhook setup
.update(Buffer.from(request.body, 'utf-8'))
.digest('base64');
// Compare the computed HMAC with the signature from the request
if (signature === verify) {
console.log("success");
} else {
console.log("verification failed");
}
```
The **Search** input above the log list accepts free-text terms and structured `alias:value` filters. Type a query and the results update as you type.
#### Free-Text Search
Type bare words to match anywhere in the raw log entry. Matching is case-insensitive, and every word must match (AND):
```
checkpoint stream
```
Wrap a phrase in double quotes to match the exact sequence:
```
"sync stream complete"
```
Free-text search matches against the full entry, including the message text and every metadata property. This is independent of the **Display Options** toggle that controls whether metadata pills are rendered, so a match on a metadata value still returns the entry even if the pills in the UI are hidden.
#### Property Filters
Use `alias:value` to filter on a specific property. Unlike free-text search, a property filter only matches the named property, not the rest of the log entry. Repeating the same alias matches any of the listed values (OR within a property, AND across properties):
```
user_id: user_id: error:PSYNC_S2001
```
Quote values that contain spaces:
```
close_reason:"client closing stream"
```
The following aliases are supported for Sync & API logs. For most properties the alias matches the canonical property name; `error` and `lag` keep a short form because their underlying paths are awkward to type. You can also type the short aliases shown in parentheses; they are normalised to the canonical name on submit.
| Alias | Property | Description |
| ------------------------- | -------------- | ------------------------------------------------------------------------ |
| `user_id` (`user`) | `user_id` | The authenticated user ID for the sync session. |
| `client_id` (`client`) | `client_id` | The client device ID. |
| `rid` (`request`) | `rid` | The request ID. Matches a started or complete entry. |
| `error` | `error_code` | A specific PSYNC error code (see [Error Codes](/debugging/error-codes)). |
| `close_reason` (`reason`) | `close_reason` | Why the sync session closed. |
For Replication logs:
| Alias | Property | Description |
| ----- | ----------------- | ----------------------------------------------------------------------- |
| `lag` | `replication_lag` | Replication lag in seconds. Used with a numeric comparison (see below). |
#### Numeric Comparisons
The `lag` filter accepts `>`, `>=`, `<`, `<=`, and `=`:
```
lag:>=5
```
Only one numeric comparison is allowed per property. Combining `lag:>5 lag:<10` is rejected.
#### Excluding Results
Prefix a term or filter with `-` to exclude matching entries. This is useful for hiding known-noisy errors while triaging:
```
-error:PSYNC_S2106
```
Exclusion works with both syntaxes:
* `-alias:value` hides entries where the property matches the value. Repeating a negated alias hides every listed value: `-user_id:123 -user_id:456` hides both users.
* `-word` hides entries containing the text anywhere in the entry. Quote phrases: `-"token expired"`.
Only an unquoted `-` at the start of a term excludes. A hyphen inside a term matches literally (`powersync-js`), and quoting keeps a leading hyphen literal: `"-foo"` finds entries containing `-foo` rather than excluding `foo`.
Numeric comparisons **cannot** be negated. You should use the inverse comparison instead: `lag:<5` rather than `-lag:>=5`.
#### Filtering on Other Properties
The **Property filters** button in the toolbar lists the aliases for the active log type. Log entries can contain many additional properties, and you can filter on any of them using `alias:value` syntax directly in the search bar. For example:
```
buckets:1
```
Filters are evaluated against the matching property on each log entry.
You can also add a metadata property as a filter directly from any log entry. Enable the **Metadata** display option to render each entry's structured properties as pills. Click a pill to open its menu and choose **Add filter**:
This is the quickest way to filter on properties you spot in the logs without remembering their names.
#### Combined Example
You can mix free-text terms, known aliases, unknown properties, and exclusions in a single query:
```
checkpoint sync user_id:123 checkpoint:>=1224 -error:PSYNC_S2106
```
This matches entries containing both `checkpoint` and `sync` in the message, with `user_id` equal to `123` and a `checkpoint` property greater than or equal to `1224`, excluding entries with error code `PSYNC_S2106`.
### Export Logs
Click the **Download** button on the right side of the toolbar to export the currently visible log entries to a CSV file. The export reflects the active log type, time range, log levels, and search query, so you can narrow the result set before downloading.
The CSV uses fixed columns for the most useful fields and collapses anything else into a trailing `metadata` JSON column:
| Column | Description |
| -------------- | ---------------------------------------------------------------- |
| `timestamp` | ISO 8601 timestamp of the entry. |
| `level` | Log level (`info`, `error`, `warn`, `debug`). |
| `message` | Formatted log message. |
| `user_id` | Authenticated user ID (Sync & API logs). |
| `client_id` | Client device ID (Sync & API logs). |
| `rid` | Request ID (Sync & API logs). |
| `error_code` | PSYNC error code if the entry has one. |
| `close_reason` | Close reason for sync session entries. |
| `metadata` | JSON object containing every other top-level field on the entry. |
The file is named `powersync-logs--.csv` where `` is the export time in UTC.
The export only includes entries currently loaded in the view. If you have not scrolled to load more entries with **Load More**, those entries are not included in the CSV.
### Correlating Sync Sessions
To find a specific user's session in the Sync & API logs, search for their `user_id`:
```
user_id:
```
Two events describe each sync session:
* **Sync stream started**: logged when the client connects. Fields include `user_id`, `client_id`, `app_metadata` (if set), `client_params`, `user_agent`, and `rid` (request id).
* **Sync stream complete**: logged when the session ends. Fields include `user_id`, `client_id`, `app_metadata` (if set), `operations_synced`, `operation_counts` (broken down by `put`, `remove`, `move`, `clear`), `data_synced_bytes`, `data_sent_bytes`, `stream_ms` (session duration), `close_reason`, and `rid`.
Both events share the same `rid`, so you can match a started/complete pair for a single session by searching for it:
```
rid:
```
For diagnosing sync latency, see [Diagnosing Sync Latency](/debugging/troubleshooting#diagnosing-sync-latency).
## Custom Metadata in Sync Logs
Custom metadata in sync logs allows clients to attach additional context to their PowerSync connection for improved observability and analytics. This metadata appears in the Sync & API logs, making it easier to track, debug, and analyze sync behavior across your app. For example, you can tag connections with app version, feature flags, or business context.
### How to Use Custom Metadata
You can specify application metadata when calling `PowerSyncDatabase.connect()`. To update the metadata, reconnect with new metadata values.
**Version compatibility**: This feature requires JavaScript/Web SDK v1.30.0+, React Native SDK v1.28.0+, Node.js SDK v0.15.0+, or Capacitor SDK v0.2.0+, and PowerSync Service v1.17.0+.
```javascript theme={null}
import { PowerSyncDatabase } from '@powersync/web'; // Update this to the appropriate SDK package
const powerSync = new PowerSyncDatabase({
schema: AppSchema,
database: {
dbFilename: 'powersync.db'
}
});
// Set custom metadata when connecting
powerSync.connect(connector, {
appMetadata: {
app_version: '1.2.3',
feature_flag: 'new_sync_flow'
}
});
```
**Version compatibility**: This feature requires Dart/Flutter SDK v1.17.0+ and PowerSync Service v1.17.0+.
```dart theme={null}
import 'package:powersync/powersync.dart';
final powerSync = PowerSyncDatabase(
schema: AppSchema,
path: 'powersync.db'
);
await powerSync.initialize();
// Set custom metadata when connecting
const options = SyncOptions(
appMetadata: {
'app_version': '1.2.3',
'feature_flag': 'new_sync_flow'
}
);
powerSync.connect(
connector: MyConnector(),
options: options
);
```
**Version compatibility**: This feature requires Kotlin SDK v1.10.0+ and PowerSync Service v1.17.0+.
```kotlin theme={null}
import com.powersync.DatabaseDriverFactory
import com.powersync.PowerSyncDatabase
// Android
val driverFactory = DatabaseDriverFactory(this)
// iOS & Desktop
// val driverFactory = DatabaseDriverFactory()
val powerSync = PowerSyncDatabase({
factory: driverFactory,
schema: AppSchema,
dbFilename: "powersync.db"
})
// Set custom metadata when connecting
powerSync.connect(
connector = MyConnector(),
appMetadata = mapOf(
"app_version" to "1.2.3",
"feature_flag" to "new_sync_flow"
)
)
```
**Version compatibility**: This feature requires Swift SDK v1.9.0+ and PowerSync Service v1.17.0+.
```swift theme={null}
import PowerSync
let schema = AppSchema
let connector = Connector() // This connector must conform to PowerSyncBackendConnector
let powerSync = PowerSyncDatabase(
schema: schema,
dbFilename: "powersync.db"
)
// Set custom metadata when connecting
try await powerSync.connect(
connector: connector,
options: ConnectOptions(
appMetadata: [
"app_version": "1.2.3",
"feature_flag": "new_sync_flow"
]
)
)
```
**Version compatibility**: This feature requires .NET SDK v0.0.6-alpha.1+ and PowerSync Service v1.17.0+.
```csharp theme={null}
using PowerSync.Common.Client;
using PowerSync.Common.Client.Sync.Stream;
var powerSync = new PowerSyncDatabase(new PowerSyncDatabaseOptions
{
Database = new SQLOpenOptions { DbFilename = "powersync.db" },
Schema = AppSchema.PowerSyncSchema,
});
await powerSync.Init();
// Set custom metadata when connecting
await powerSync.Connect(
connector: new MyConnector(),
options: new PowerSyncConnectionOptions
{
AppMetadata = new Dictionary
{
{ "app_version", "1.2.3" },
{ "feature_flag", "new_sync_flow" }
}
}
);
```
Example not yet available.
### View Custom Metadata in Logs
Custom metadata appears in the **Sync & API logs** section of the [PowerSync Dashboard](https://dashboard.powersync.com/). Navigate to your project and instance, then go to the **Logs** view. The metadata is included in **Sync stream started** and **Sync stream complete** log entries.
Make sure the **Metadata** checkbox is enabled in the logs view to see custom metadata in log entries.
To filter on a custom metadata key in the search bar, prefix it with `app_metadata_`. For example, for `{ region: 'us-east' }`:
```
app_metadata_region:us-east
```
The same prefix applies when clicking **Add filter** on a custom metadata pill.
Note the following when using custom metadata:
* Keep metadata values concise. `app_metadata` is limited to 20 keys, with each string value capped at 100 characters.
* Avoid including sensitive information in metadata as it will appear in logs.
* Metadata is set per connection. Reconnect with new metadata when user context or app state changes (e.g., feature flags).
## Issue Alerts
Issue alerts capture potential problems with your instance, such as connection or replication issues.
**Availability**
* Issue alerts are available on all Cloud plans.
### Configure Issue Alerts
Issue alerts are set up per instance. To set up a new alert, navigate to the **Alerts** section in the [PowerSync Dashboard](https://dashboard.powersync.com/) and click **Create Issue Alert**.
When creating or editing an issue alert, you can configure:
* **Alert Name**: Give your alert a descriptive name to help identify it
* **Issue Type**: Select the type of issue to monitor from the dropdown:
* **Database Connection Issue**: Trigger when there is a connection problem
* **Replication Issue**: Trigger when there is an issue with the replication process
* **Severity Levels**: Select which severity levels should trigger this alert:
* **Warning**: For non-critical issues
* **Fatal**: For critical issues that require immediate attention
**Important: Set Up Notification Rules**
Creating an issue alert only defines *what* to monitor. To actually receive notifications when alerts trigger, you must also set up [Email Rules](#email-notifications) or [Webhooks](#webhooks) and configure them to notify for "Issue alert state change" events. See the [Alert Notifications](#alert-notifications) section below.
## Usage Alerts
Usage alerts trigger when specific usage metrics exceed a defined threshold. This helps with troubleshooting usage spikes, or unexpected usage activity.
**Availability**
Usage alerts are available on **Team** and **Enterprise** plans.
### Configure Usage Alerts
Usage alerts are set up per instance. Navigate to the **Alerts** section in the [PowerSync Dashboard](https://dashboard.powersync.com/) and click **Create Usage Alert**.
When creating or editing a usage alert, you can configure:
* **Alert Name**: Give your alert a descriptive name to help identify it
* **Metric**: Select from the following usage metrics to monitor:
* Data Synced
* Data Replicated
* Operations Synced
* Operations Replicated
* Peak Concurrent Connections
* Storage Size
These metrics correspond to the data shown in the [Usage Metrics](#view-usage-metrics) workspace and align with the PowerSync Service parameters outlined in our [pricing](https://www.powersync.com/pricing).
* **Window**: The number of minutes to look back when evaluating usage. All usage data points within this time window are included when determining if the configured threshold has been crossed
* **Aggregation**: Select how to aggregate all data points within the window before comparing to the threshold:
* **Avg**: Calculate the average of all values
* **Max**: Use the highest value
* **Min**: Use the lowest value
* **Condition**: Set whether the alert triggers when usage goes **Above** or **Below** the specified threshold
* **Threshold Value**: The numeric limit for the selected metric (in bytes for size-based metrics; count for all other metrics)
**Important: Set Up Notification Rules**
Creating a usage alert only defines *what* to monitor. To actually receive notifications when alerts trigger, you must also set up [Email Rules](#email-notifications) or [Webhooks](#webhooks) and configure them to notify for "Usage alert state change" events. See the [Alert Notifications](#alert-notifications) section below.
## Alert Notifications
Set up notification rules to be informed of issue or usage alerts, as well as deploy state changes. PowerSync provides multiple notification methods that trigger both when an alert becomes active and when it returns to normal (indicating the monitored conditions are back within acceptable thresholds).
* **Email Rules**: Send alerts directly to your email address
* **Webhooks**: Notify external systems and services
**Availability**
* **Email Rules**: Available on all plans (**Free**, **Pro**, **Team** and **Enterprise**)
* **Webhooks**: Available on **Pro**, **Team** and **Enterprise** plans
### Email Rules
Email rules allow you to receive alerts directly to your email address when specific events occur in PowerSync.
#### Set Up Email Rules
Navigate to the **Alerts** section in the [PowerSync Dashboard](https://dashboard.powersync.com/) and scroll down to the **Notification Rules** section. Click **Create Email Rule** to set up email notifications.
Accounts on the Free plan are restricted to a single email rule; customers on paid plans can create an unlimited number of email rules.
When creating or editing an email rule, you can configure:
* **Recipient Email**: Specify the email address that will receive the notifications (required)
* **Event Triggers**: Select one or more of the following events to trigger the email notification:
* **Usage alert state change**: Fired when a usage alert changes between 'monitoring' and 'alerting' (a threshold has been crossed)
* **Issue alert state change**: Fired when an issue alert changes between 'monitoring' and 'alerting' (the instance has active issues)
* **Deploy state change**: Fired when an instance deploy starts, completes or fails. This includes deprovisioning an instance
* **Enabled**: Toggle to control whether the email rule is active
### Webhooks
Webhooks enable you to notify external systems when specific events occur in PowerSync.
#### Set Up Webhooks
Navigate to the **Alerts** section in the [PowerSync Dashboard](https://dashboard.powersync.com/) and scroll down to the **Notification Rules** section. Click **Create Webhook Rule** to set up webhook notifications.
When creating or editing a webhook rule, you can configure:
* **Webhook Endpoint (URL)**: Define the endpoint that will receive the webhook request (starting with `https://`) (required)
* **Event Triggers**: Select one or more of the following events to trigger the webhook:
* **Usage alert state change**: Fired when a usage alert changes between 'monitoring' and 'alerting' (a threshold has been crossed)
* **Issue alert state change**: Fired when an issue alert changes between 'monitoring' and 'alerting' (the instance has active issues)
* **Deploy state change**: Fired when an instance deploy starts, completes or fails. This includes deprovisioning an instance
* **Enabled**: Toggle to control whether the webhook rule is active
* **Retries**: Configure the number of retry attempts for failed webhook deliveries
After creating a webhook, a secret is automatically generated and copied to your clipboard. Store this secret since you'll need it to verify the webhook request signature.
### Webhook Signature Verification
Every webhook request contains an `x-journey-signature` header, which is a base64-encoded HMAC (Hash-based Message Authentication Code). To verify the request, you need to compute the HMAC using the shared secret that was generated when you created the webhook, and compare it to the value in the `x-journey-signature` header.
**JavaScript Example:**
```javascript theme={null}
import { createHmac } from 'crypto';
// Extract the signature from the request headers
const signature = request.header('x-journey-signature');
// Create an HMAC using your webhook secret and the request body
let verify = createHmac('sha256', '') // The secret provided during webhook setup
.update(Buffer.from(request.body, 'utf-8'))
.digest('base64');
// Compare the computed HMAC with the signature from the request
if (signature === verify) {
console.log("success");
} else {
console.log("verification failed");
}
```